Here, you'll find out more about the major, including such details as the number of graduates, what degree levels are offered, ethnicity of students, average salaries, and more. In addition, we cover how Loyola Chicago ranks in comparison to other schools with neurobiology programs.
Go directly to any of the following sections:
The bachelor's program at Loyola Chicago was ranked #43 on College Factual's Best Schools for neurobiology list. It is also ranked #4 in Illinois.
| Ranking Type | Rank |
|---|---|
| Best Neurobiology & Neurosciences Bachelor’s Degree Schools | 37 |
| Best Neurobiology & Neurosciences Schools | 43 |
During the 2021-2022 academic year, Loyola University Chicago handed out 114 bachelor's degrees in neurobiology & neurosciences. This is a decrease of 19% over the previous year when 140 degrees were handed out.
In 2022, 2 students received their master’s degree in neurobiology from Loyola Chicago. This makes it the #34 most popular school for neurobiology master’s degree candidates in the country.
In addition, 1 students received their doctoral degrees in neurobiology in 2022, making the school the #103 most popular school in the United States for this category of students.
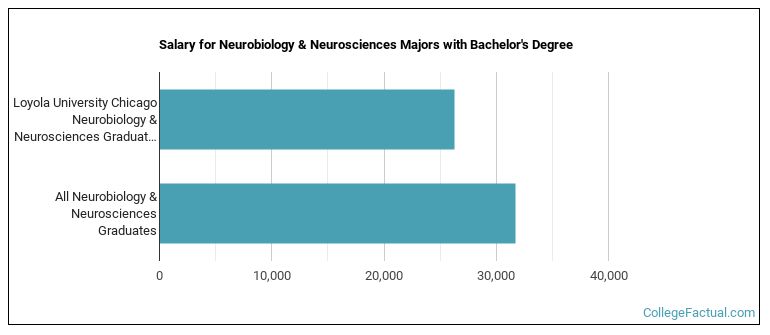
The median salary of neurobiology students who receive their bachelor's degree at Loyola Chicago is $26,251. This is less than $31,687, which is the national median of all neurobiology majors in the nation who earn bachelor's degrees.
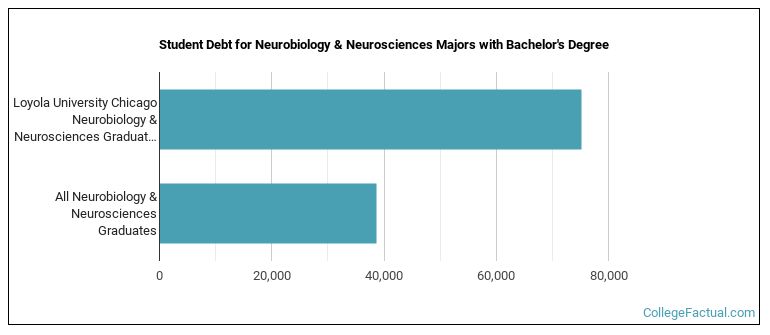
While getting their bachelor's degree at Loyola Chicago, neurobiology students borrow a median amount of $75,160 in student loans. This is higher than the the typical median of $38,750 for all neurobiology majors across the country.
The typical student loan payment of a bachelor's degree student from the neurobiology program at Loyola Chicago is $767 per month.
During the 2022-2023 academic year, part-time undergraduate students at Loyola Chicago paid an average of $925 per credit hour. No discount was available for in-state students. The average full-time tuition and fees for undergraduates are shown in the table below.
| In State | Out of State | |
|---|---|---|
| Tuition | $50,270 | $50,270 |
| Fees | $1,446 | $1,446 |
| Books and Supplies | $1,200 | $1,200 |
| On Campus Room and Board | $16,894 | $16,894 |
| On Campus Other Expenses | $1,600 | $1,600 |
Learn more about Loyola Chicago tuition and fees.
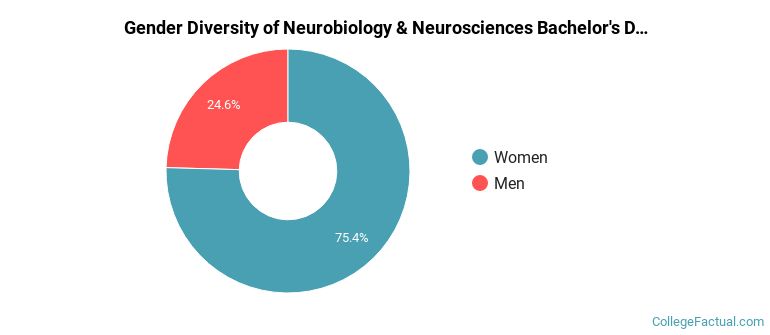
Of the 114 students who graduated with a Bachelor’s in neurobiology from Loyola Chicago in 2022, 25% were men and 75% were women.
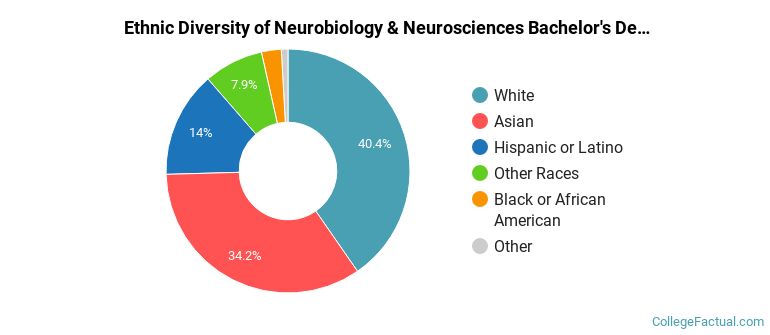
The following table and chart show the ethnic background for students who recently graduated from Loyola University Chicago with a bachelor's in neurobiology.
| Ethnic Background | Number of Students |
|---|---|
| Asian | 39 |
| Black or African American | 3 |
| Hispanic or Latino | 16 |
| White | 46 |
| Non-Resident Aliens | 1 |
| Other Races | 9 |
Loyola Chicago does not offer an online option for its neurobiology bachelor’s degree program at this time. To see if the school offers distance learning options in other areas, visit the Loyola Chicago Online Learning page.
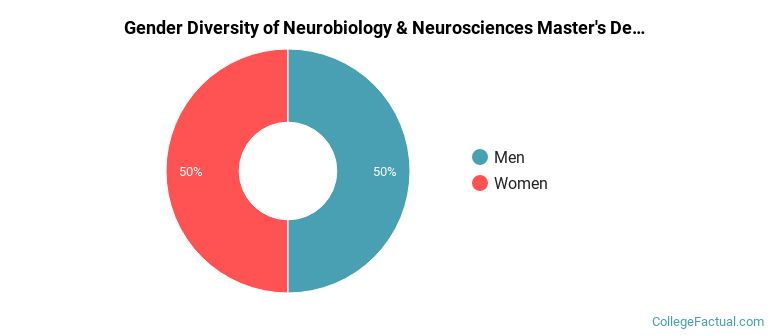
During the 2021-2022 academic year, 4 students graduated with a master's degree in neurobiology from Loyola Chicago. About 50% were men and 50% were women.
The following table and chart show the ethnic background for students who recently graduated from Loyola University Chicago with a master's in neurobiology.
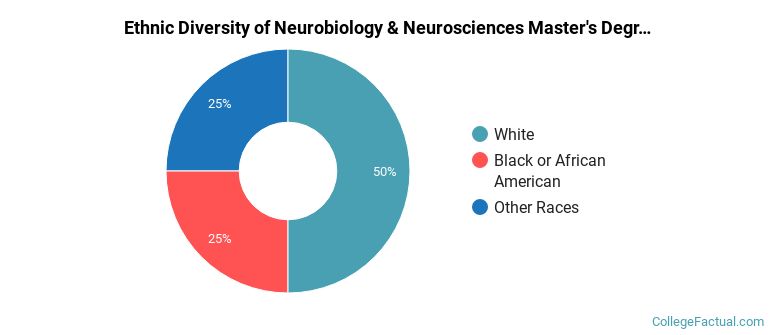
| Ethnic Background | Number of Students |
|---|---|
| Asian | 0 |
| Black or African American | 1 |
| Hispanic or Latino | 0 |
| White | 2 |
| Non-Resident Aliens | 0 |
| Other Races | 1 |
Take a look at the following statistics related to the make-up of the neurobiology majors at Loyola University Chicago.
| Related Major | Annual Graduates |
|---|---|
| General Biology | 372 |
| Biochemistry, Biophysics & Molecular Biology | 41 |
| Physiology & Pathology Sciences | 23 |
| Biomathematics & Bioinformatics | 18 |
| Cell Biology & Anatomical Sciences | 4 |
More about our data sources and methodologies.