Explore the best ranked schools for the programs you are most interested in.
Lyon was not ranked in College Factual's Best Overall Colleges report this year. This may be because not enough data was available.
The acceptance rate at Lyon College is a competitive 60%, so make sure you take your application seriously when putting it together. Even leaving out a minor detail could be a reason to move you to the rejection pile.
The student to faculty ratio at Lyon is an impressive 9 to 1. That's quite good when you compare it to the national average of 15 to 1. This is a good sign that students at the school will have more opportunities for one-on-one interactions with their professors.
Another measure that is often used to estimate how much access students will have to their professors is how many faculty members are full-time. The idea here is that part-time faculty tend to spend less time on campus, so they may not be as available to students as full-timers.
The full-time faculty percentage at Lyon College is 86%. This is higher than the national average of 47%.
The freshmen retention rate is a sign of how many full-time students like a college or university well enough to come back for their sophomore year. At Lyon College this rate is 51%, which is a bit lower than the national average of 68%.
The on-time graduation rate is the percent of first-time, full-time students who get their bachelor's degree with four years. At Lyon this rate is 37%, which is about average when compared to the national rate of 33.3%.
Find out more about the retention and graduation rates at Lyon College.
During the 2017-2018 academic year, there were 665 undergraduates at Lyon with 650 being full-time and 15 being part-time.
| $0-30 K | $30K-48K | $48-75 | $75-110K | $110K + |
|---|---|---|---|---|
| $21,673 | $20,562 | $23,598 | $30,162 | $27,780 |
The net price is calculated by adding tuition, room, board and other costs and subtracting financial aid.Note that the net price is typically less than the published for a school. For more information on the sticker price of Lyon, see our tuition and fees and room and board pages.
It's not uncommon for college students to take out loans to pay for school. In fact, almost 66% of students nationwide depend at least partially on loans. At Lyon, approximately 70% of students took out student loans averaging $9,913 a year. That adds up to $39,652 over four years for those students.
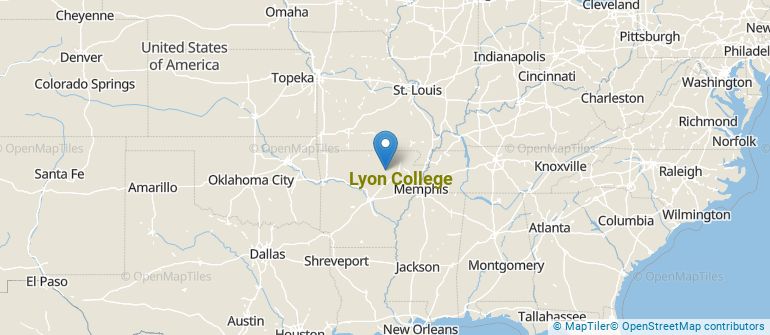
Get more details about the location of Lyon College.
Contact details for Lyon are given below.
| Contact Details | |
|---|---|
| Address: | 2300 Highland Road, Batesville, AR 72501 |
| Phone: | 870-307-7000 |
| Website: | www.lyon.edu/ |
| Most Popular Majors | Bachelor’s Degrees | Average Salary of Graduates |
|---|---|---|
| Business Administration & Management | 32 | NA |
| General Psychology | 24 | NA |
| General Biology | 23 | NA |
| Finance & Financial Management | 13 | NA |
| Computer Science | 12 | NA |
| Economics | 12 | NA |
| Fine & Studio Arts | 10 | NA |
| Mathematics | 9 | NA |
| Political Science & Government | 9 | NA |
| Teacher Education Grade Specific | 6 | NA |
Online learning is becoming popular at even the oldest colleges and universities in the United States. Not only are online classes great for returning adults with busy schedules, they are also frequented by a growing number of traditional students.
In 2022-2023, 17 students took at least one online class at Lyon College. This is an increase from the 0 students who took online classes the previous year.
| Year | Took at Least One Online Class | Took All Classes Online |
|---|---|---|
| 2022-2023 | 17 | 0 |
| 2021-2022 | 0 | 0 |
| 2020-2021 | 0 | 0 |
| 2018-2019 | 0 | 0 |
If you’re considering Lyon College, here are some more schools you may be interested in knowing more about.
Curious on how these schools stack up against Lyon? Pit them head to head with College Combat, our free interactive tool that lets you compare college on the features that matter most to you!
Footnotes
*The racial-ethnic minorities count is calculated by taking the total number of students and subtracting white students, international students, and students whose race/ethnicity was unknown. This number is then divided by the total number of students at the school to obtain the racial-ethnic minorities percentage.
References
More about our data sources and methodologies.