Explore the best ranked schools for the programs you are most interested in.
MCC was not ranked in College Factual's Best Overall Colleges report this year. This may be because not enough data was available.
Manhattan Christian College has an acceptance rate of 48%, which means the school is serious about who it admits. Take your time in putting together a strong application that highlights why you are a good fit for MCC.
About 6% of students accepted to MCC submitted their SAT scores.MCC received ACT scores from 71% of accepted students. When looking at the 25th through the 75th percentile, ACT Composite scores ranged between 15 and 23.
At MCC, the student to faculty ratio is an excellent 12 to 1. That's much better than the national average of 15 to 1. This indicates that many classes will probably be small, and students will have ample opportunites to work closely with their professors and classmates.
When estimating how much access students will have to their teachers, some people like to look at what percentage of faculty members are full time. This is because part-time teachers may not have as much time to spend on campus as their full-time counterparts.
The full-time faculty percentage at Manhattan Christian College is 37%. This is lower than the national average of 47%.
The freshmen retention rate is a sign of how many full-time students like a college or university well enough to come back for their sophomore year. At Manhattan Christian College this rate is 57%, which is a bit lower than the national average of 68%.
When we say that a student has graduated on time, we mean that they have finished their bachelor's degree within four years. The on-time graduation rate at MCC is 21%. That's lower than the national rate of 33.3%
Find out more about the retention and graduation rates at Manhattan Christian College.
During the 2017-2018 academic year, there were 170 undergraduates at MCC with 127 being full-time and 43 being part-time.
| $0-30 K | $30K-48K | $48-75 | $75-110K | $110K + |
|---|---|---|---|---|
| $18,798 | $18,237 | $23,711 | $24,025 | $27,996 |
The net price is calculated by adding tuition, room, board and other costs and subtracting financial aid.Note that the net price is typically less than the published for a school. For more information on the sticker price of MCC, see our tuition and fees and room and board pages.
While almost two-thirds of students nationwide take out loans to pay for college, the percentage may be quite different for the school you plan on attending. At MCC, approximately 77% of students took out student loans averaging $4,203 a year. That adds up to $16,812 over four years for those students.
Get more details about paying for Manhattan Christian College.
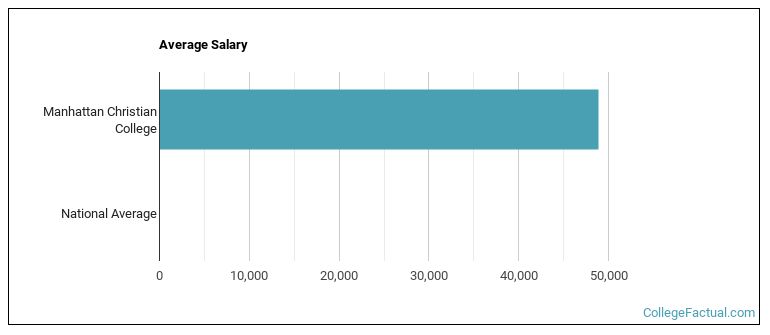
See which majors at Manhattan Christian College make the most money.
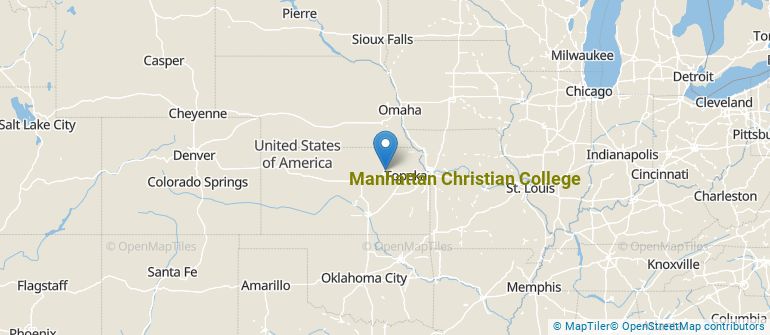
Get more details about the location of Manhattan Christian College.
Contact details for MCC are given below.
| Contact Details | |
|---|---|
| Address: | 1415 Anderson Ave, Manhattan, KS 66502-4801 |
| Phone: | 785-539-3571 |
| Website: | www.mccks.edu/ |
| Most Popular Majors | Bachelor’s Degrees | Average Salary of Graduates |
|---|---|---|
| Biblical Studies | 28 | $36,357 |
| Business Administration & Management | 5 | NA |
| Pastoral Counseling & Specialized Ministries | 4 | NA |
| Liberal Arts General Studies | 3 | NA |
| Theological & Ministerial Studies | 0 | NA |
Online courses area a great option for busy, working students as well as for those who have scheduling conflicts and want to study on their own time. As time goes by, expect to see more and more online learning options become available.
In 2022-2023, 31 students took at least one online class at Manhattan Christian College. This is an increase from the 28 students who took online classes the previous year.
| Year | Took at Least One Online Class | Took All Classes Online |
|---|---|---|
| 2022-2023 | 31 | 26 |
| 2021-2022 | 28 | 24 |
| 2020-2021 | 21 | 17 |
| 2018-2019 | 12 | 12 |
Learn more about online learning at Manhattan Christian College.
Footnotes
*The racial-ethnic minorities count is calculated by taking the total number of students and subtracting white students, international students, and students whose race/ethnicity was unknown. This number is then divided by the total number of students at the school to obtain the racial-ethnic minorities percentage.
References
More about our data sources and methodologies.