Explore the best ranked schools for the programs you are most interested in.
Manhattanville is ranked #1,052 out of 2,152 schools in the nation for overall quality on College Factual's 2025 Best Colleges list.
Manhattanville also holds the #94 spot on the Best Colleges in New York ranking.
The acceptance rate at Manhattanville College is 84%. That's higher than the rate at many schools, but still low enough to be considered somewhat selective. If you want to get in, you'll need good grades and to be able to show that Manhattanville is a good fit for you.
The student to faculty ratio is often used to measure the number of teaching resources that a college or university offers its students. The national average for this metric is 15 to 1, but at Manhattanville it is much better at 12 to 1. That's good news for students who want to interact more on a personal level with their teachers.
In addition to the student to faculty ratio, some people look at what percentage of faculty members are full-time as a sign of how much time professors will be able to spend with their students. This is because part-time teachers may not be be on campus as much as their full-time counterparts.
The full-time faculty percentage at Manhattanville College is 36%. This is lower than the national average of 47%.
The freshmen retention rate of 80% tells us that most first-year, full-time students like Manhattanville College enough to come back for another year. This is a fair bit higher than the national average of 68%. That's certainly something to check off in the good column about the school.
Students are considered to have graduated on time if they finish their studies within four years. At Manhattanville the on-time graduation rate of first-time, full-time students is 57%. That is great when compared to the national average of 33.3%
Find out more about the retention and graduation rates at Manhattanville College.
During the 2017-2018 academic year, there were 1,409 undergraduates at Manhattanville with 1,333 being full-time and 76 being part-time.
| $0-30 K | $30K-48K | $48-75 | $75-110K | $110K + |
|---|---|---|---|---|
| $16,968 | $14,249 | $21,158 | $24,188 | $26,913 |
The net price is calculated by adding tuition, room, board and other costs and subtracting financial aid.Note that the net price is typically less than the published for a school. For more information on the sticker price of Manhattanville, see our tuition and fees and room and board pages.
Almost 66% of college students who graduated with the class of 2018 took out student loans, but that percentage varies from school to school. At Manhattanville, approximately 46% of students took out student loans averaging $8,273 a year. That adds up to $33,092 over four years for those students.
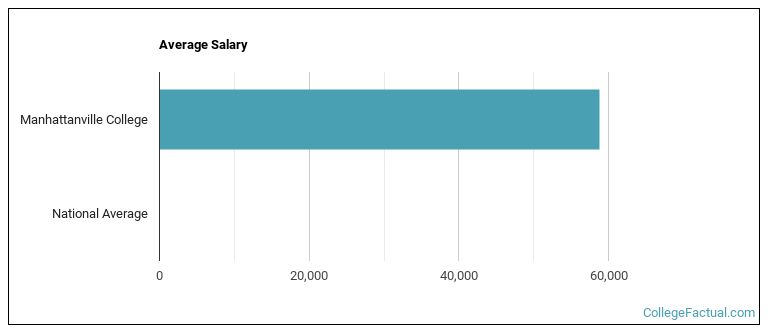
See which majors at Manhattanville College make the most money.
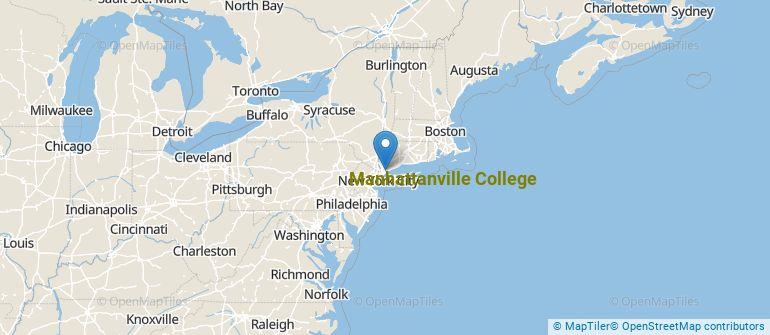
Get more details about the location of Manhattanville College.
Contact details for Manhattanville are given below.
| Contact Details | |
|---|---|
| Address: | 2900 Purchase St, Purchase, NY 10577 |
| Phone: | 914-694-2200 |
| Website: | https://www.mville.edu/ |
| Most Popular Majors | Bachelor’s Degrees | Average Salary of Graduates |
|---|---|---|
| Teacher Education Subject Specific | 103 | NA |
| Special Education | 90 | NA |
| Nursing | 77 | NA |
| Health & Physical Education | 66 | $25,592 |
| General Psychology | 54 | $21,970 |
| Clinical, Counseling & Applied Psychology | 46 | NA |
| Educational Administration | 44 | NA |
| Teacher Education Grade Specific | 37 | $28,575 |
| Business Administration & Management | 36 | $35,423 |
| Drama & Theater Arts | 24 | NA |
Online learning options are becoming more and more popular at American colleges and universities. Online classes are great for students who have busy schedules or for those who just want to study on their own time.
In 2022-2023, 813 students took at least one online class at Manhattanville College. This is a decrease from the 1,067 students who took online classes the previous year.
| Year | Took at Least One Online Class | Took All Classes Online |
|---|---|---|
| 2022-2023 | 813 | 387 |
| 2021-2022 | 1,067 | 454 |
| 2020-2021 | 2,088 | 644 |
| 2018-2019 | 27 | 0 |
Footnotes
*The racial-ethnic minorities count is calculated by taking the total number of students and subtracting white students, international students, and students whose race/ethnicity was unknown. This number is then divided by the total number of students at the school to obtain the racial-ethnic minorities percentage.
References
More about our data sources and methodologies.