Marian total enrollment is approximately 3,706 students. 2,218 are undergraduates and 813 are graduate students.
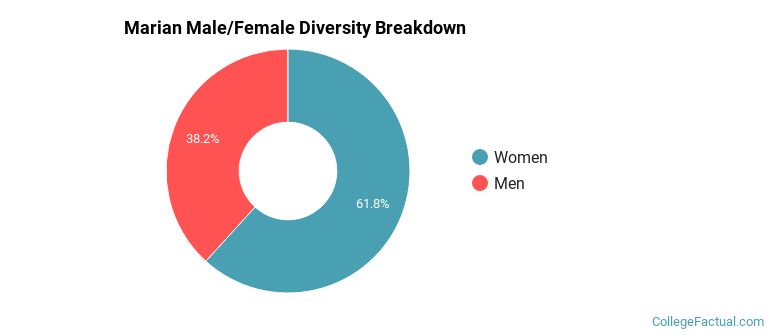
Male/Female Breakdown of Undergraduates
The full-time Marian undergraduate population is made up of 63% women, and 37% men.

For the gender breakdown for all students, go here.
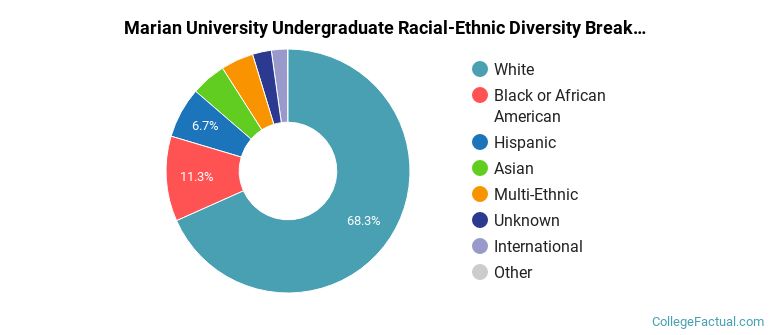
Marian Racial/Ethnic Breakdown of Undergraduates

| Race/Ethnicity | Number |
|---|---|
| White | 1,477 |
| Black or African American | 276 |
| Hispanic | 168 |
| Multi-Ethnic | 105 |
| Asian | 71 |
| Unknown | 64 |
| International | 51 |
| Native Hawaiian or Pacific Islander | 4 |
See racial/ethnic breakdown for all students.
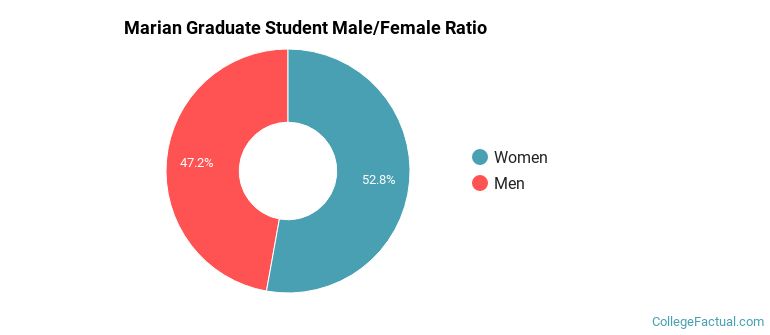
Male/Female Breakdown of Graduate Students
About 52% of full-time grad students are women, and 48% men.
For the gender breakdown for all students, go here.
Marian Racial-Ethnic Breakdown of Graduate Students

| Race/Ethnicity | Number |
|---|---|
| White | 518 |
| Asian | 82 |
| Black or African American | 53 |
| Multi-Ethnic | 49 |
| Hispanic | 46 |
| Unknown | 35 |
| International | 25 |
| Native Hawaiian or Pacific Islander | 1 |
See racial/ethnic breakdown for all students.
| Race/Ethnicity | Number |
|---|---|
| White | 2,410 |
| Black or African American | 468 |
| Hispanic | 256 |
| Multi-Ethnic | 181 |
| Asian | 174 |
| Unknown | 127 |
| International | 78 |
| Native Hawaiian or Pacific Islander | 5 |
There are approximately 2,332 female students and 1,374 male students at Marian.
Marian ranks 1,381 out of 2,183 when it comes to geographic diversity.
16.71% of Marian students come from out of state, and 0.77% come from out of the country.

The undergraduate student body is split among 15 states (may include Washington D.C.). Click on the map for more detail.

| State | Amount |
|---|---|
| Indiana | 324 |
| Ohio | 29 |
| Kentucky | 9 |
| Illinois | 8 |
| Michigan | 5 |
Students from 26 countries are represented at this school, with the majority of the international students coming from Canada, Germany, and Saudi Arabia.
Learn more about international students at Marian.
A traditional college student is defined as being between the ages of 18-21. At Marian, 34.91% of students fall into that category, compared to the national average of 60%.

| Student Age Group | Amount |
|---|---|
| 22-24 | 860 |
| 25-29 | 747 |
| 18-19 | 623 |
| 20-21 | 574 |
| 35 and over | 328 |
| 30-34 | 211 |
| Under 18 | 0 |
Footnotes
*The racial-ethnic minorities count is calculated by taking the total number of students and subtracting white students, international students, and students whose race/ethnicity was unknown. This number is then divided by the total number of students at the school to obtain the racial-ethnic minorities percentage.
References
Department of Homeland Security Citizenship and Immigration Services
Image Credit: By university under License
Read College Factual's Diversity Ranking Methodology.