We’ve pulled together the essential facts you should know about the program at Marshall University. Degrees are awarded at the Bachelor’s, Certificate levels, with graduate study also available. At its best it places at #7 out of 11 schools (Bachelor’s level) by College Factual. Jump to any of the following sections:
College Factual rates Marshall University among the top schools in the country for liberal arts general studies, coming in at #1,147 out of 1,506 schools nationally.
| Ranking | Rank |
|---|---|
| Best Liberal Arts General Studies Schools | 1,147 of 1,506 |
| Best Liberal Arts General Studies Schools in West Virginia | 8 of 19 |
| Best Liberal Arts General Studies Schools in the Southeast Region | 281 of 420 |
The following degree levels are available for liberal arts general studies at Marshall University, along with how many graduates complete each level annually.
| Degree Level | Annual Graduates |
|---|---|
| Bachelor’s | 153 |
| Certificate | 5 |
| Master’s | 3 |
During the most recent reporting year, Marshall University awarded 153 bachelor’s degrees in liberal arts general studies.
Marshall University is a solid choice among schools offering liberal arts general studies at the bachelor’s level. Specifically, it ranked #7 out of 11 schools by College Factual.
Liberal Arts General Studies graduates with a bachelor’s degree from Marshall University go on to jobs where they make a median salary of $36,014 a year. This is lower than $62,090, the median for all majors at Marshall University.
To complete a bachelor’s at Marshall University, liberal arts general studies graduates take on a median debt of $29,248 in student loans. This is higher than $25,139, the typical median for all majors at Marshall University.

Average full-time tuition and fees are listed in the table below.
| In State | Out of State | |
|---|---|---|
| Tuition | $7,190 | $18,748 |
| Fees | $1,594 | $1,594 |
Learn more about Marshall University tuition and fees.
Among recent graduates, 42% of liberal arts general studies bachelor’s degrees went to men and 58% went to women.
 The largest share of liberal arts general studies bachelor’s degree graduates at Marshall University are White. About 73% of graduates fell into this category.
The following table and chart show the ethnic background for students who recently graduated from Marshall University with a bachelor’s in liberal arts general studies.
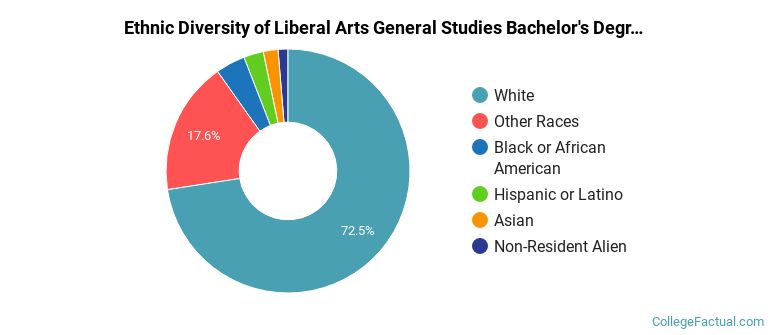
| Ethnic Background | Number of Students |
|---|---|
| Asian | 3 |
| Black or African American | 6 |
| Hispanic or Latino | 4 |
| White | 111 |
| Non-Resident Aliens | 2 |
| Other Races | 27 |
Marshall University granted 148 bachelor’s degrees in general studies recently — 59% to women and 41% to men. The largest share of these graduates were White (72%).
Marshall University granted 5 bachelor’s degrees in humanities/humanistic studies in the most recent reporting year — 40% to women and 60% to men. The largest share of these graduates were White (80%).
During the most recent reporting year, Marshall University awarded 5 certificate degrees in liberal arts general studies.
Marshall University is not yet ranked for liberal arts general studies at the certificate level.
In the most recent graduating class, 80% of liberal arts general studies certificate degrees went to men and 20% went to women.
 The majority of liberal arts general studies certificate degree graduates at Marshall University were White. Approximately 100% of graduates fell into this category.
The following table and chart show the ethnic background for students who recently graduated from Marshall University with a certificate in liberal arts general studies.
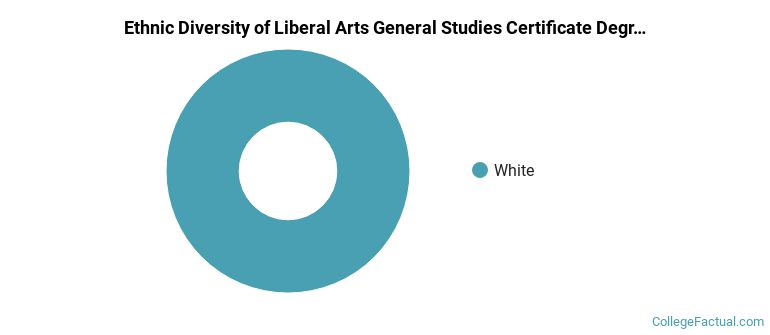
| Ethnic Background | Number of Students |
|---|---|
| Asian | 0 |
| Black or African American | 0 |
| Hispanic or Latino | 0 |
| White | 5 |
| Non-Resident Aliens | 0 |
| Other Races | 0 |
Marshall University granted 5 certificate completions in liberal arts and sciences/liberal studies in the most recent reporting year — 20% to women and 80% to men. The most common background among these graduates was White (100%).
You can also pursue this field at the graduate level at Marshall University. The following graduate award levels are reported.
| Graduate Level | Annual Graduates |
|---|---|
| Master’s Degrees in Liberal Arts General Studies | 3 |
