College Factual analyzes over 2,000 colleges and universities in its annual rankings and ranks them in a variety of ways, including most diverse, best overall quality, best for non-traditional students, and much more.
Martin Luther College was awarded 17 badges in the 2025 rankings. The highest ranked major at the school is music education.
Explore the best ranked schools for the programs you are most interested in.
MLC was not ranked in College Factual's 2025 Best Overall Colleges report. This could be for a number of reasons, including lack of data.
Martin Luther College has an acceptance rate of 84%, which makes it somewhat selective. Make sure it's not the only school you apply to, even if it's your school of choice. Whether you get in or not will largely depend on how you compare to other applicants.
About 7% of students accepted to MLC submitted their SAT scores. When looking at the 25th through the 75th percentile, SAT Evidence-Based Reading and Writing scores ranged between 533 and 643. Math scores were between 518 and 673.
The student to faculty ratio is often used to measure the number of teaching resources that a college or university offers its students. The national average for this metric is 15 to 1, but at MLC it is much better at 9 to 1. That's good news for students who want to interact more on a personal level with their teachers.
Another measure that is often used to estimate how much access students will have to their professors is how many faculty members are full-time. The idea here is that part-time faculty tend to spend less time on campus, so they may not be as available to students as full-timers.
The full-time faculty percentage at Martin Luther College is 74%. This is higher than the national average of 47%.
The freshmen retention rate of 86% tells us that most first-year, full-time students like Martin Luther College enough to come back for another year. This is a fair bit higher than the national average of 68%. That's certainly something to check off in the good column about the school.
The on-time graduation rate for someone pursuing a bachelor's degree is typically four years. This rate at MLC for first-time, full-time students is 44%, which is better than the national average of 33.3%.
Find out more about the retention and graduation rates at Martin Luther College.
During the 2017-2018 academic year, there were 850 undergraduates at MLC with 700 being full-time and 150 being part-time.
| $0-30 K | $30K-48K | $48-75 | $75-110K | $110K + |
|---|---|---|---|---|
| $17,830 | $18,668 | $17,793 | $21,039 | $25,706 |
The net price is calculated by adding tuition, room, board and other costs and subtracting financial aid.Note that the net price is typically less than the published for a school. For more information on the sticker price of MLC, see our tuition and fees and room and board pages.
It's not uncommon for college students to take out loans to pay for school. In fact, almost 66% of students nationwide depend at least partially on loans. At MLC, approximately 46% of students took out student loans averaging $7,185 a year. That adds up to $28,740 over four years for those students.
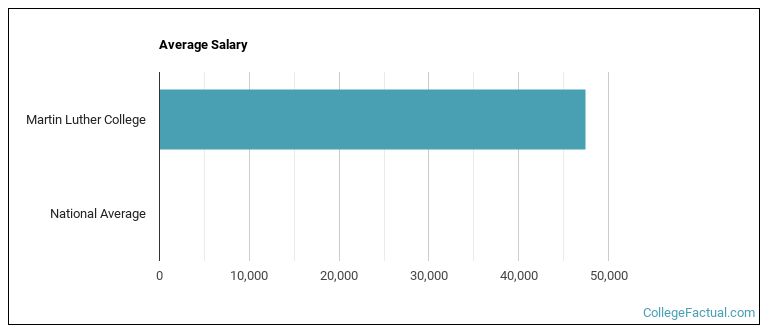
See which majors at Martin Luther College make the most money.
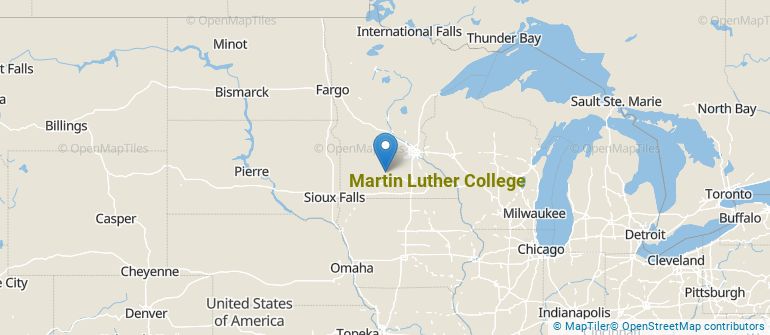
Get more details about the location of Martin Luther College.
Contact details for MLC are given below.
| Contact Details | |
|---|---|
| Address: | 1995 Luther Ct, New Ulm, MN 56073-3965 |
| Phone: | 507-354-8221 |
| Website: | www.mlc-wels.edu/ |
| Most Popular Majors | Bachelor’s Degrees | Average Salary of Graduates |
|---|---|---|
| Teacher Education Grade Specific | 81 | $46,706 |
| Theological & Ministerial Studies | 55 | $15,327 |
| Theology & Religious Vocations (Other) | 44 | NA |
| Teacher Education Subject Specific | 30 | NA |
| Educational Administration | 14 | NA |
| General Education | 14 | NA |
| Other Education | 6 | NA |
| Pastoral Counseling & Specialized Ministries | 5 | NA |
| Special Education | 4 | NA |
| Missionary Studies | 3 | NA |
Online learning is becoming popular at even the oldest colleges and universities in the United States. Not only are online classes great for returning adults with busy schedules, they are also frequented by a growing number of traditional students.
In 2022-2023, 287 students took at least one online class at Martin Luther College. This is an increase from the 271 students who took online classes the previous year.
| Year | Took at Least One Online Class | Took All Classes Online |
|---|---|---|
| 2022-2023 | 287 | 260 |
| 2021-2022 | 271 | 265 |
| 2020-2021 | 293 | 260 |
| 2018-2019 | 214 | 196 |
Footnotes
*The racial-ethnic minorities count is calculated by taking the total number of students and subtracting white students, international students, and students whose race/ethnicity was unknown. This number is then divided by the total number of students at the school to obtain the racial-ethnic minorities percentage.
References
More about our data sources and methodologies.