We've pulled together some essential information you should know about the program, including how many students graduate each year, the ethnic diversity of these students, and more. In addition, we cover how Maryville U ranks in comparison to other schools with health science programs.
Go directly to any of the following sections:
The bachelor's program at Maryville U was ranked #189 on College Factual's Best Schools for health science list. It is also ranked #6 in Missouri.
| Ranking Type | Rank |
|---|---|
| Best Health Sciences & Services Bachelor’s Degree Schools | 122 |
| Best Health Sciences & Services Schools | 189 |
During the 2021-2022 academic year, Maryville University of Saint Louis handed out 37 bachelor's degrees in health sciences & services. This is a decrease of 3% over the previous year when 38 degrees were handed out.
During the 2022-2023 academic year, part-time undergraduate students at Maryville U paid an average of $781 per credit hour. No discount was available for in-state students. The average full-time tuition and fees for undergraduates are shown in the table below.
| In State | Out of State | |
|---|---|---|
| Tuition | $24,766 | $24,766 |
| Fees | $2,400 | $2,400 |
| On Campus Room and Board | $13,300 | $13,300 |
| On Campus Other Expenses | $4,300 | $4,300 |
Learn more about Maryville U tuition and fees.
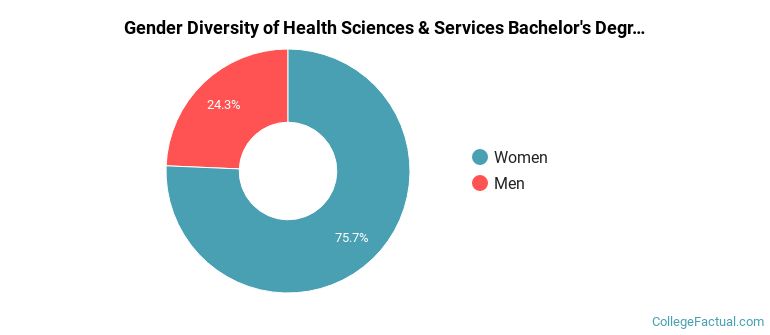
During the 2021-2022 academic year, 37 students graduated with a bachelor's degree in health science from Maryville U. About 24% were men and 76% were women.
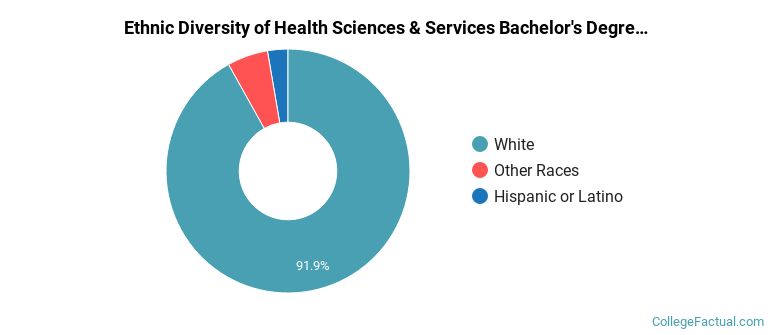
The majority of the students with this major are white. About 92% of 2022 graduates were in this category.
The following table and chart show the ethnic background for students who recently graduated from Maryville University of Saint Louis with a bachelor's in health science.
| Ethnic Background | Number of Students |
|---|---|
| Asian | 0 |
| Black or African American | 0 |
| Hispanic or Latino | 1 |
| White | 34 |
| Non-Resident Aliens | 0 |
| Other Races | 2 |
Online degrees for the Maryville U health science bachelor’s degree program are not available at this time. To see if the school offers distance learning options in other areas, visit the Maryville U Online Learning page.
Take a look at the following statistics related to the make-up of the health science majors at Maryville University of Saint Louis.
| Related Major | Annual Graduates |
|---|---|
| Nursing | 1,386 |
| Rehabilitation & Therapeutic Professions | 92 |
| Health & Medical Administrative Services | 78 |
| Communication Sciences | 44 |
| Health/Medical Prep Programs | 11 |
More about our data sources and methodologies.