Explore the best ranked schools for the programs you are most interested in.
According to College Factual's 2025 analysis, Maysville Community and Technical College is ranked #2,040 out of 2,152 schools in the nation that were analyzed for overall quality. This is an improvement over the previous year, when Maysville Community and Technical College held the #2,160 spot on the Best Overall Colleges list.
Out of the 39 colleges in Kentucky, Maysville Community and Technical College is ranked at #33.
See all of the rankings for Maysville Community and Technical College.
If you are worried about getting into Maysville Community and Technical College, don't be. The school has a liberal open admissions policy, which means you only need to meet basic requirements in order to be admitted. Still, be sure to submit a complete application and provide any other requested materials.
The student to faculty ratio is often used as a measure to gauge how much access students will have to their professors - the lower the number, the better. At Maysville Community and Technical College, this rate is 19 to 1, which is high when compared to the national average of 15 to 1.
Another measure that is often used to estimate how much access students will have to their professors is how many faculty members are full-time. The idea here is that part-time faculty tend to spend less time on campus, so they may not be as available to students as full-timers.
The full-time faculty percentage at Maysville Community and Technical College is 98%. This is higher than the national average of 47%.
The freshmen retention rate tells us what percentage of first-year, full-time students choose to continue on to their sophomore year at a particular school. The rate at Maysville Community and Technical College is 66%, which is about average when compared to the national rate of 68%.
Find out more about the retention and graduation rates at Maysville Community and Technical College.
During the 2017-2018 academic year, there were 3,446 undergraduates at Maysville Community and Technical College with 1,186 being full-time and 2,260 being part-time.
| $0-30 K | $30K-48K | $48-75 | $75-110K | $110K + |
|---|---|---|---|---|
| $4,014 | $3,564 | $5,775 | $8,269 | $8,945 |
The net price is calculated by adding tuition, room, board and other costs and subtracting financial aid.Note that the net price is typically less than the published for a school. For more information on the sticker price of Maysville Community and Technical College, see our tuition and fees and room and board pages.
It's not uncommon for college students to take out loans to pay for school. In fact, almost 66% of students nationwide depend at least partially on loans. At Maysville Community and Technical College, approximately 16% of students took out student loans averaging $4,626 a year. That adds up to $18,504 over four years for those students.
Get more details about paying for Maysville Community and Technical College.
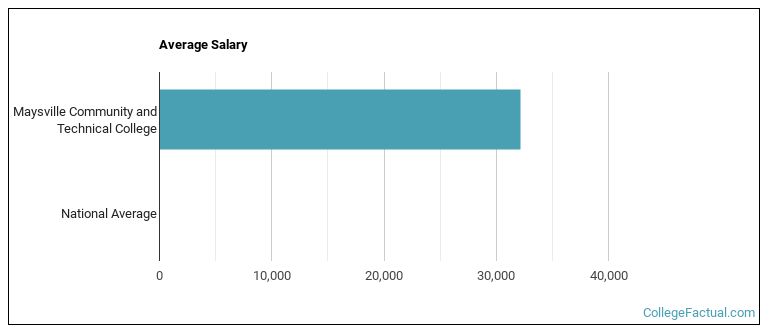
See which majors at Maysville Community and Technical College make the most money.
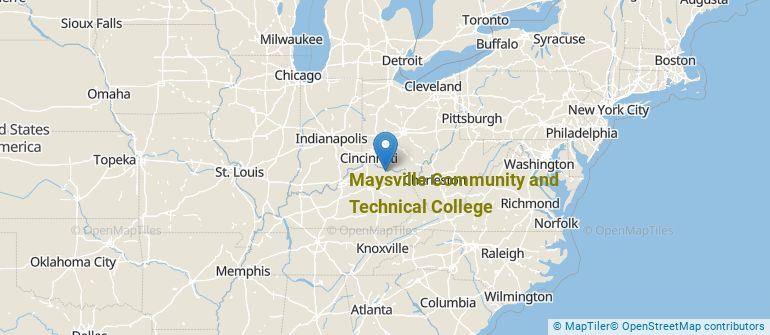
Get more details about the location of Maysville Community and Technical College.
Contact details for Maysville Community and Technical College are given below.
| Contact Details | |
|---|---|
| Address: | 1755 U.S. Hwy 68, Maysville, KY 41056 |
| Phone: | 606-759-7141 |
| Website: | https://maysville.kctcs.edu/ |
| Most Popular Majors | Bachelor’s Degrees | Average Salary of Graduates |
|---|---|---|
| Precision Metal Working | 434 | NA |
| Business Administration & Management | 311 | NA |
| Electrical & Power Transmission Installers | 237 | NA |
| Business Support & Assistant Services | 232 | NA |
| Practical Nursing & Nursing Assistants | 211 | NA |
| Liberal Arts General Studies | 189 | NA |
| Heating, Air Conditioning, Ventilation & Refrigeration | 164 | NA |
| Computer Information Systems | 159 | NA |
| Vehicle Maintenance & Repair | 140 | NA |
| Health & Medical Administrative Services | 129 | NA |
Online learning is becoming popular at even the oldest colleges and universities in the United States. Not only are online classes great for returning adults with busy schedules, they are also frequented by a growing number of traditional students.
In 2022-2023, 2,223 students took at least one online class at Maysville Community and Technical College. This is an increase from the 2,056 students who took online classes the previous year.
| Year | Took at Least One Online Class | Took All Classes Online |
|---|---|---|
| 2022-2023 | 2,223 | 1,408 |
| 2021-2022 | 2,056 | 1,283 |
| 2020-2021 | 2,102 | 1,171 |
| 2018-2019 | 2,083 | 1,026 |
Learn more about online learning at Maysville Community and Technical College.
Footnotes
*The racial-ethnic minorities count is calculated by taking the total number of students and subtracting white students, international students, and students whose race/ethnicity was unknown. This number is then divided by the total number of students at the school to obtain the racial-ethnic minorities percentage.
References
More about our data sources and methodologies.