We've pulled together some essential information you should know about the program, including how many students graduate each year, the ethnic diversity of these students, average starting salaries, and more. We've also included details on how Michigan State ranks compared to other colleges offering a major in hospitality.
Jump to any of the following sections:
In College Factual's most recent rankings for the best schools for hospitality majors, Michigan State came in at #9. This puts it in the top 5% of the country in this field of study. It is also ranked #1 in Michigan.
| Ranking Type | Rank |
|---|---|
| Best Hospitality Management Schools | 9 |
| Best Hospitality Management Bachelor’s Degree Schools | 9 |
During the 2021-2022 academic year, Michigan State University handed out 154 bachelor's degrees in hospitality management. This is a decrease of 13% over the previous year when 177 degrees were handed out.
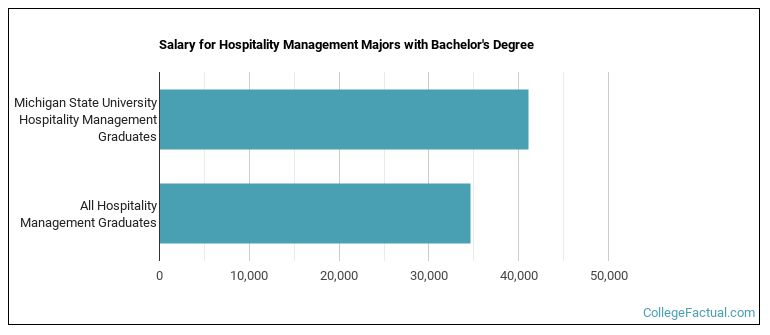
The median salary of hospitality students who receive their bachelor's degree at Michigan State is $41,069. This is great news for graduates of the program, since this figure is higher than the national average of $34,656 for all hospitality bachelor's degree recipients.
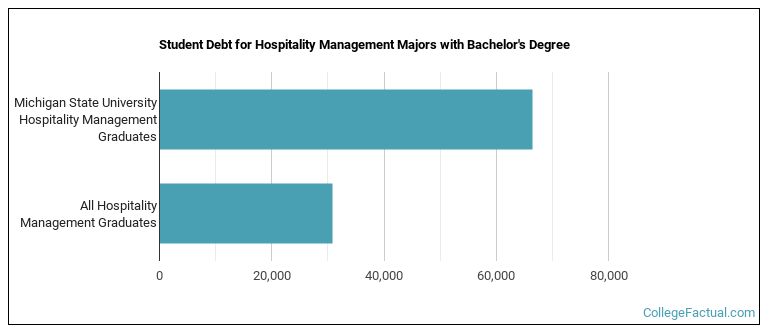
While getting their bachelor's degree at Michigan State, hospitality students borrow a median amount of $66,547 in student loans. This is higher than the the typical median of $30,766 for all hospitality majors across the country.
The typical student loan payment of a bachelor's degree student from the hospitality program at Michigan State is $619 per month.
In 2022-2023, the average part-time undergraduate tuition at Michigan State was $1,457 per credit hour for out-of-state students. The average for in-state students was $564 per credit hour. The following table shows the average full-time tuition and fees for undergraduates.
| In State | Out of State | |
|---|---|---|
| Tuition | $16,930 | $43,700 |
| Fees | $340 | $340 |
| Books and Supplies | $1,334 | $1,334 |
| On Campus Room and Board | $11,754 | $11,754 |
| On Campus Other Expenses | $3,592 | $3,592 |
Learn more about Michigan State tuition and fees.
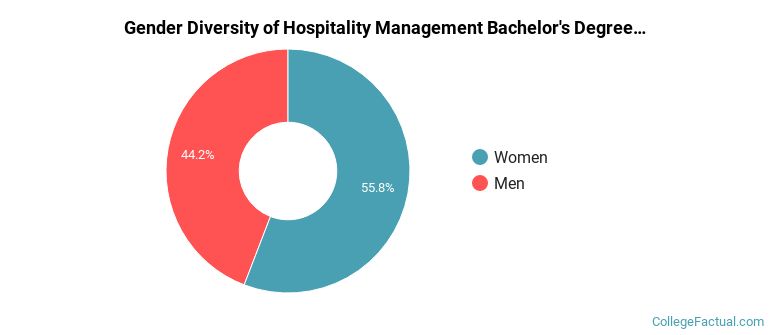
The hospitality program at Michigan State awarded 154 bachelor's degrees in 2021-2022. About 44% of these degrees went to men with the other 56% going to women.
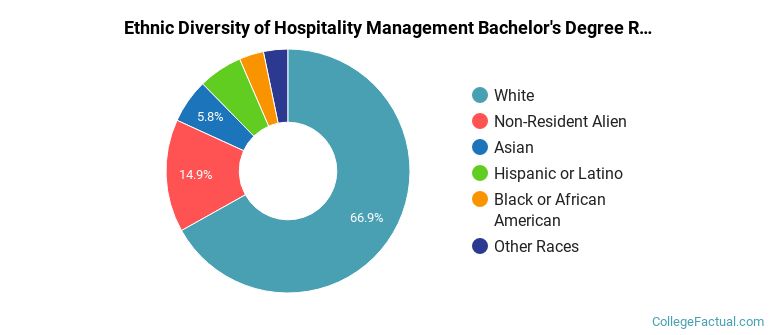
The majority of bachelor's degree recipients in this major at Michigan State are white. In the most recent graduating class for which data is available, 67% of students fell into this category.
The following table and chart show the ethnic background for students who recently graduated from Michigan State University with a bachelor's in hospitality.
| Ethnic Background | Number of Students |
|---|---|
| Asian | 9 |
| Black or African American | 5 |
| Hispanic or Latino | 9 |
| White | 103 |
| Non-Resident Aliens | 23 |
| Other Races | 5 |
Online degrees for the Michigan State hospitality bachelor’s degree program are not available at this time. To see if the school offers distance learning options in other areas, visit the Michigan State Online Learning page.
Take a look at the following statistics related to the make-up of the hospitality majors at Michigan State University.
| Related Major | Annual Graduates |
|---|---|
| Business Administration & Management | 749 |
| Finance & Financial Management | 364 |
| Marketing | 288 |
| Human Resource Management | 204 |
| Management Sciences & Quantitative Methods | 199 |
More about our data sources and methodologies.