Explore the best ranked schools for the programs you are most interested in.
Mid-America College was not ranked in College Factual's 2025 Best Overall Colleges report. This could be for a number of reasons, including lack of data.
See all of the rankings for Mid-America College of Funeral Service.
Mid-America College of Funeral Service has an open admissions policy, so you should not have much trouble being accepted by the school. Still, it is important to fill out the application completely and submit any requested materials, which may include proof that you have a high school diploma or the equivalent.
The student to faculty ratio is often used to measure the number of teaching resources that a college or university offers its students. The national average for this metric is 15 to 1, but at Mid-America College it is much better at 11 to 1. That's good news for students who want to interact more on a personal level with their teachers.
In addition to the student to faculty ratio, some people look at what percentage of faculty members are full-time as a sign of how much time professors will be able to spend with their students. This is because part-time teachers may not be be on campus as much as their full-time counterparts.
The full-time faculty percentage at Mid-America College of Funeral Service is 19%. This is lower than the national average of 47%.
The freshmen retention rate of 9% tells us that most first-year, full-time students don't stick around for a second year at Mid-America College of Funeral Service. Students may have a variety of reasons for this, such as only intending to attend a school for one year while they brush up on certain subjects.
The on-time graduation rate is the percent of first-time, full time students who obtain their bachelor's degree in four years or less. This rate is 14% for first-time, full-time students at Mid-America College, which is lower than the national rate of 33.3%.
Find out more about the retention and graduation rates at Mid-America College of Funeral Service.
During the 2017-2018 academic year, there were 92 full-time undergraduates at Mid-America College.
The net price is calculated by adding tuition, room, board and other costs and subtracting financial aid.Note that the net price is typically less than the published for a school. For more information on the sticker price of Mid-America College, see our tuition and fees and room and board pages.
Almost 66% of college students who graduated with the class of 2018 took out student loans, but that percentage varies from school to school. At Mid-America College, approximately 90% of students took out student loans averaging $9,421 a year. That adds up to $37,684 over four years for those students.
Get more details about paying for Mid-America College of Funeral Service.
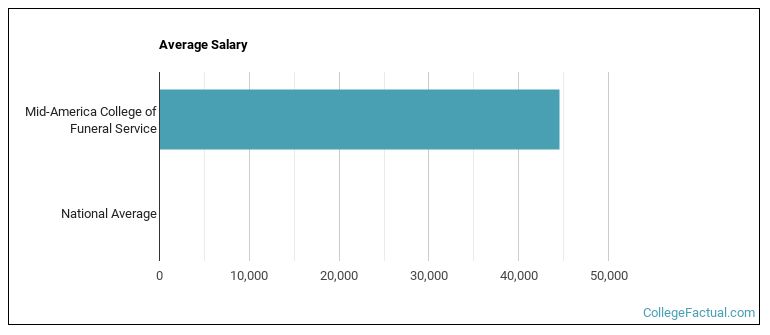
See which majors at Mid-America College of Funeral Service make the most money.
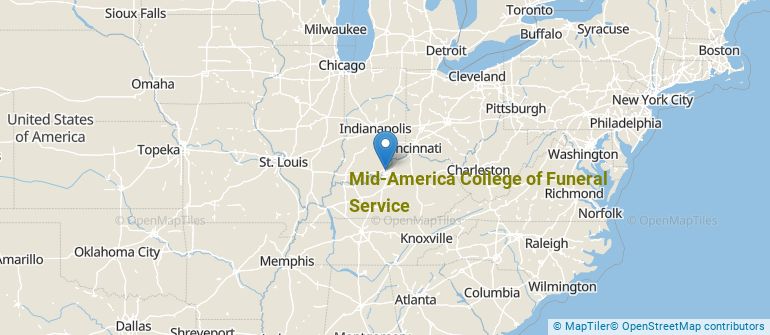
Get more details about the location of Mid-America College of Funeral Service.
Contact details for Mid-America College are given below.
| Contact Details | |
|---|---|
| Address: | 3111 Hamburg Pke, Jeffersonville, IN 47130 |
| Phone: | 812-288-8878 |
| Website: | www.mid-america.edu/ |
| Most Popular Majors | Bachelor’s Degrees | Average Salary of Graduates |
|---|---|---|
| Funeral & Mortuary Science | 74 | $56,427 |
Online learning options are becoming more and more popular at American colleges and universities. Online classes are great for students who have busy schedules or for those who just want to study on their own time.
In 2022-2023, 330 students took at least one online class at Mid-America College of Funeral Service. This is an increase from the 268 students who took online classes the previous year.
| Year | Took at Least One Online Class | Took All Classes Online |
|---|---|---|
| 2022-2023 | 330 | 324 |
| 2021-2022 | 268 | 253 |
| 2020-2021 | 78 | 76 |
| 2018-2019 | 122 | 118 |
Learn more about online learning at Mid-America College of Funeral Service.
Footnotes
*The racial-ethnic minorities count is calculated by taking the total number of students and subtracting white students, international students, and students whose race/ethnicity was unknown. This number is then divided by the total number of students at the school to obtain the racial-ethnic minorities percentage.
References
More about our data sources and methodologies.