We've gathered data and other essential information about the program, such as the ethnicity of students, how many students graduated in recent times, and more. Also, learn how Middlesex Community College ranks among other schools offering degrees in grade specific ed.
Jump to any of the following sections:
The bachelor's program at Middlesex Community College was ranked #499 on College Factual's Best Schools for grade specific ed list.
During the 2022-2023 academic year, part-time undergraduate students at Middlesex Community College paid an average of $505 per credit hour if they came to the school from out-of-state. In-state students paid a discounted rate of $252 per credit hour. Information about average full-time undergraduate tuition and fees is shown in the table below.
| In State | Out of State | |
|---|---|---|
| Tuition | $576 | $5,520 |
| Fees | $5,522 | $6,650 |
| Books and Supplies | $1,100 | $1,100 |
Learn more about Middlesex Community College tuition and fees.
Online degrees for the Middlesex Community College grade specific ed bachelor’s degree program are not available at this time. To see if the school offers distance learning options in other areas, visit the Middlesex Community College Online Learning page.
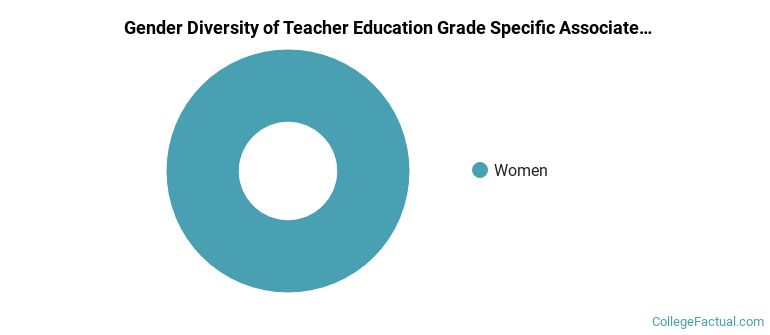
All of the 16 students who graduated with a Associate’s in grade specific ed from Middlesex Community College in 2022 were women.
The following table and chart show the ethnic background for students who recently graduated from Middlesex Community College with a associate's in grade specific ed.
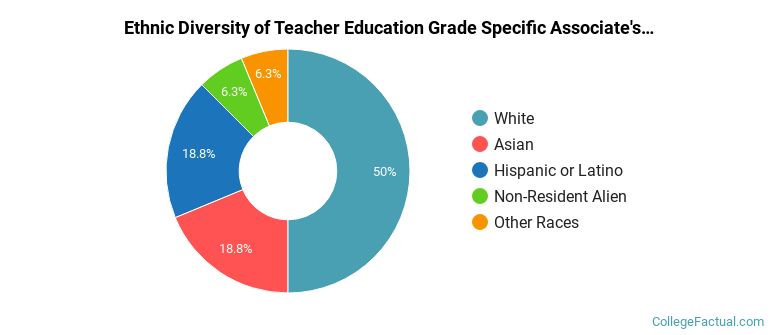
| Ethnic Background | Number of Students |
|---|---|
| Asian | 3 |
| Black or African American | 0 |
| Hispanic or Latino | 3 |
| White | 8 |
| Non-Resident Aliens | 1 |
| Other Races | 1 |