In its yearly rankings, College Factual analyzes over 2,000 colleges and universities to determine which ones are the best in a variety of categories, such as overall value, quality, diversity, which schools are the best for each major, and much more.
Milligan University was awarded 22 badges in the 2025 rankings. The highest ranked major at the school is mental & social health services.
Explore the best ranked schools for the programs you are most interested in.
College Factual ranked Milligan as #1,613 out of 2,152 colleges and universities in the country on its 2025 Best Colleges list.
Milligan is also ranked #31 out of 41 schools in Tennessee.
If you're applying to Milligan University you'll face some tough competition, since the school's acceptance rate is only 67%. Definitely don't wait until the last minute to submit your application, since applying early may be in your favor.
Milligan received ACT scores from 74% of accepted students. When looking at the 25th through the 75th percentile, ACT Composite scores ranged between 21 and 27.
The student to faculty ratio is often used to measure the number of teaching resources that a college or university offers its students. The national average for this metric is 15 to 1, but at Milligan it is much better at 9 to 1. That's good news for students who want to interact more on a personal level with their teachers.
When estimating how much access students will have to their teachers, some people like to look at what percentage of faculty members are full time. This is because part-time teachers may not have as much time to spend on campus as their full-time counterparts.
The full-time faculty percentage at Milligan University is 64%. This is higher than the national average of 47%.
The freshmen retention rate tells us what percentage of first-year, full-time students choose to continue on to their sophomore year at a particular school. The rate at Milligan University is 72%, which is about average when compared to the national rate of 68%.
Students are considered to have graduated on time if they finish their studies within four years. At Milligan the on-time graduation rate of first-time, full-time students is 61%. That is great when compared to the national average of 33.3%
Find out more about the retention and graduation rates at Milligan University.
During the 2017-2018 academic year, there were 941 undergraduates at Milligan with 786 being full-time and 155 being part-time.
| $0-30 K | $30K-48K | $48-75 | $75-110K | $110K + |
|---|---|---|---|---|
| $12,310 | $16,369 | $19,047 | $21,322 | $24,223 |
The net price is calculated by adding tuition, room, board and other costs and subtracting financial aid.Note that the net price is typically less than the published for a school. For more information on the sticker price of Milligan, see our tuition and fees and room and board pages.
While almost two-thirds of students nationwide take out loans to pay for college, the percentage may be quite different for the school you plan on attending. At Milligan, approximately 53% of students took out student loans averaging $8,206 a year. That adds up to $32,824 over four years for those students.
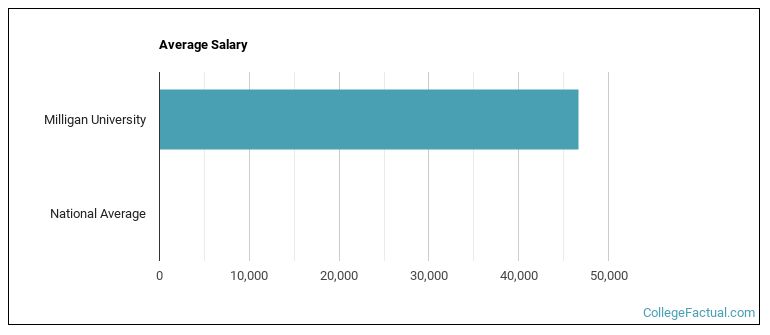
See which majors at Milligan University make the most money.
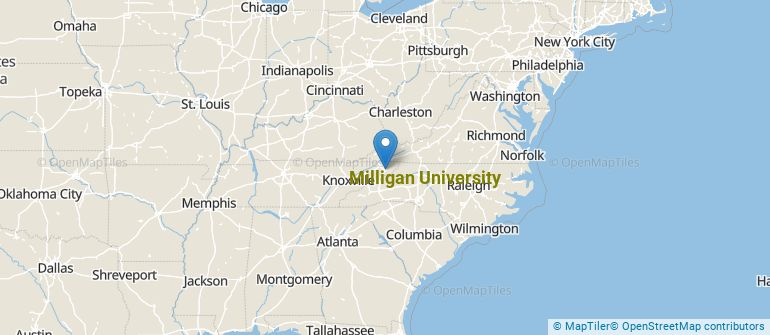
Get more details about the location of Milligan University.
Contact details for Milligan are given below.
| Contact Details | |
|---|---|
| Address: | 1 Blowers Blvd., Milligan, TN 37682 |
| Phone: | 423-461-8700 |
| Website: | www.milligan.edu/ |
| Most Popular Majors | Bachelor’s Degrees | Average Salary of Graduates |
|---|---|---|
| Business Administration & Management | 43 | $39,752 |
| Rehabilitation & Therapeutic Professions | 30 | NA |
| General Psychology | 27 | NA |
| Allied Health Professions | 24 | NA |
| Theological & Ministerial Studies | 23 | NA |
| Health & Physical Education | 20 | NA |
| Teacher Education Grade Specific | 19 | $34,888 |
| Nursing | 15 | $70,523 |
| Pastoral Counseling & Specialized Ministries | 15 | NA |
| Computer Information Systems | 12 | NA |
Online courses area a great option for busy, working students as well as for those who have scheduling conflicts and want to study on their own time. As time goes by, expect to see more and more online learning options become available.
In 2022-2023, 444 students took at least one online class at Milligan University. This is a decrease from the 502 students who took online classes the previous year.
| Year | Took at Least One Online Class | Took All Classes Online |
|---|---|---|
| 2022-2023 | 444 | 23 |
| 2021-2022 | 502 | 34 |
| 2020-2021 | 463 | 24 |
| 2018-2019 | 404 | 71 |
Footnotes
*The racial-ethnic minorities count is calculated by taking the total number of students and subtracting white students, international students, and students whose race/ethnicity was unknown. This number is then divided by the total number of students at the school to obtain the racial-ethnic minorities percentage.
References
More about our data sources and methodologies.