Here, you'll find out more about the major, including such details as the number of graduates, what degree levels are offered, ethnicity of students, average salaries, and more. We've also included details on how Missouri Southern ranks compared to other colleges offering a major in health professions.
Jump to any of the following sections:
The health professions major at Missouri Southern is not ranked on College Factual’s Best Colleges and Universities for Other Health Professions. This could be for a number of reasons, such as not having enough data on the major or school to make an accurate assessment of its quality.
During the 2021-2022 academic year, Missouri Southern State University handed out 63 bachelor's degrees in other health professions. This is an increase of 5% over the previous year when 60 degrees were handed out.
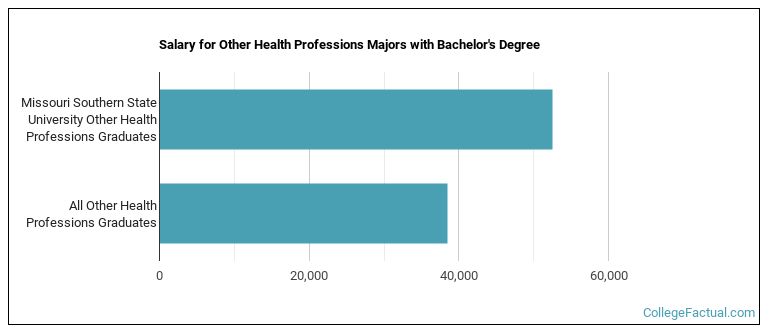
The median salary of health professions students who receive their bachelor's degree at Missouri Southern is $52,539. This is great news for graduates of the program, since this figure is higher than the national average of $38,492 for all health professions bachelor's degree recipients.
Out-of-state part-time undergraduates at Missouri Southern paid an average of $560 per credit hour in 2022-2023. The average for in-state students was $280 per credit hour. Information about average full-time undergraduate tuition and fees is shown in the table below.
| In State | Out of State | |
|---|---|---|
| Tuition | $8,400 | $16,800 |
| Books and Supplies | $1,020 | $1,020 |
| On Campus Room and Board | $7,172 | $7,172 |
| On Campus Other Expenses | $3,459 | $3,459 |
Learn more about Missouri Southern tuition and fees.
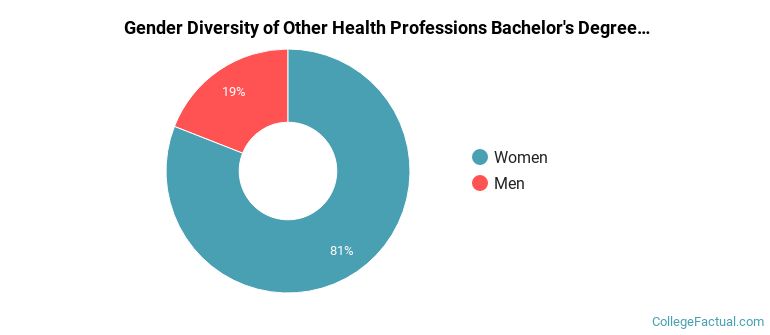
In the 2021-2022 academic year, 63 students earned a bachelor's degree in health professions from Missouri Southern. About 81% of these graduates were women and the other 19% were men.
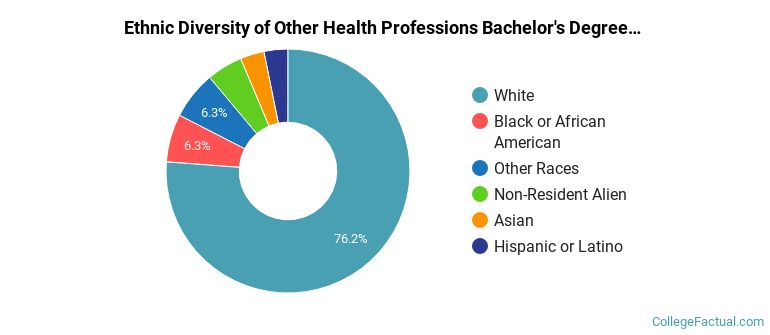
The majority of bachelor's degree recipients in this major at Missouri Southern are white. In the most recent graduating class for which data is available, 76% of students fell into this category.
The following table and chart show the ethnic background for students who recently graduated from Missouri Southern State University with a bachelor's in health professions.
| Ethnic Background | Number of Students |
|---|---|
| Asian | 2 |
| Black or African American | 4 |
| Hispanic or Latino | 2 |
| White | 48 |
| Non-Resident Aliens | 3 |
| Other Races | 4 |
Missouri Southern does not offer an online option for its health professions bachelor’s degree program at this time. To see if the school offers distance learning options in other areas, visit the Missouri Southern Online Learning page.
Take a look at the following statistics related to the make-up of the health professions majors at Missouri Southern State University.
| Related Major | Annual Graduates |
|---|---|
| Nursing | 41 |
| Allied Health Professions | 37 |
| Dental Support Services | 27 |
| Public Health | 26 |
| Health & Medical Administrative Services | 21 |