Explore the best ranked schools for the programs you are most interested in.
Monmouth was not ranked in College Factual's 2025 Best Overall Colleges report. This could be for a number of reasons, including lack of data.
With an acceptance rate of 91%, Monmouth has a fairly liberal admissions policy. However, don't just assume you'll get in! Put together a good application and make sure you include all requested documents and materials.
About 27% of students accepted to Monmouth submitted their SAT scores. When looking at the 25th through the 75th percentile, SAT Evidence-Based Reading and Writing scores ranged between 510 and 610. Math scores were between 500 and 600.
At Monmouth, the student to faculty ratio is an excellent 10 to 1. That's much better than the national average of 15 to 1. This indicates that many classes will probably be small, and students will have ample opportunites to work closely with their professors and classmates.
Another measure that is often used to estimate how much access students will have to their professors is how many faculty members are full-time. The idea here is that part-time faculty tend to spend less time on campus, so they may not be as available to students as full-timers.
The full-time faculty percentage at Monmouth College is 75%. This is higher than the national average of 47%.
Monmouth College has a freshmen retention rate of 77%. That's a good sign that full-time students like the school and their professors enough to want to stick around for another year. It's also a sign that the admissions team did a good job in choosing applicants who were a good fit for the school.
The on-time graduation rate for someone pursuing a bachelor's degree is typically four years. This rate at Monmouth for first-time, full-time students is 51%, which is better than the national average of 33.3%.
Find out more about the retention and graduation rates at Monmouth College.
During the 2017-2018 academic year, there were 860 undergraduates at Monmouth with 847 being full-time and 13 being part-time.
| $0-30 K | $30K-48K | $48-75 | $75-110K | $110K + |
|---|---|---|---|---|
| $15,626 | $16,110 | $18,196 | $19,660 | $23,988 |
The net price is calculated by adding tuition, room, board and other costs and subtracting financial aid.Note that the net price is typically less than the published for a school. For more information on the sticker price of Monmouth, see our tuition and fees and room and board pages.
It's not uncommon for college students to take out loans to pay for school. In fact, almost 66% of students nationwide depend at least partially on loans. At Monmouth, approximately 78% of students took out student loans averaging $6,998 a year. That adds up to $27,992 over four years for those students.
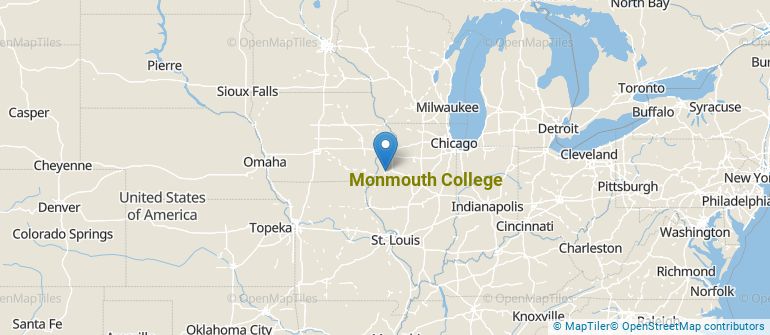
Get more details about the location of Monmouth College.
Contact details for Monmouth are given below.
| Contact Details | |
|---|---|
| Address: | 700 E Broadway, Monmouth, IL 61462-1998 |
| Phone: | 309-457-2311 |
| Website: | www.monmouthcollege.edu/ |
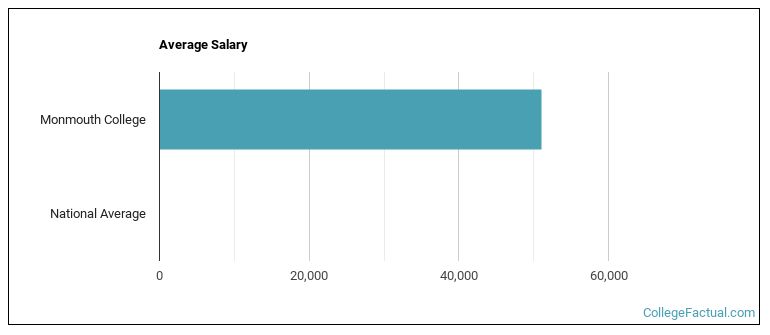
| Most Popular Majors | Bachelor’s Degrees | Average Salary of Graduates |
|---|---|---|
| Business Administration & Management | 37 | $43,162 |
| Health & Physical Education | 16 | $29,027 |
| General Psychology | 16 | NA |
| Economics | 15 | $47,048 |
| Biochemistry, Biophysics & Molecular Biology | 9 | NA |
| Public Relations & Advertising | 8 | NA |
| Teacher Education Grade Specific | 8 | NA |
| English Literature (Other) | 8 | NA |
| Accounting | 7 | NA |
| Political Science & Government | 7 | $32,103 |
Online learning is becoming popular at even the oldest colleges and universities in the United States. Not only are online classes great for returning adults with busy schedules, they are also frequented by a growing number of traditional students.
In 2022-2023, 1 students took at least one online class at Monmouth College. This is a decrease from the 2 students who took online classes the previous year.
| Year | Took at Least One Online Class | Took All Classes Online |
|---|---|---|
| 2022-2023 | 1 | 0 |
| 2021-2022 | 2 | 2 |
| 2020-2021 | 0 | 0 |
| 2018-2019 | 0 | 0 |
Footnotes
*The racial-ethnic minorities count is calculated by taking the total number of students and subtracting white students, international students, and students whose race/ethnicity was unknown. This number is then divided by the total number of students at the school to obtain the racial-ethnic minorities percentage.
References
More about our data sources and methodologies.