We've gathered data and other essential information about the program, such as the average salary of graduates, ethnicity of students, how many students graduated in recent times, and more. In addition, we cover how Morgan State ranks in comparison to other schools with subject specific ed programs.
Go directly to any of the following sections:
The bachelor's program at Morgan State was ranked #307 on College Factual's Best Schools for subject specific ed list. It is also ranked #5 in Maryland.
| Ranking Type | Rank |
|---|---|
| Best Teacher Education Subject Specific Bachelor’s Degree Schools | 273 |
| Best Teacher Education Subject Specific Schools | 307 |
During the 2021-2022 academic year, Morgan State University handed out 18 bachelor's degrees in teacher education subject specific. This is a decrease of 40% over the previous year when 30 degrees were handed out.
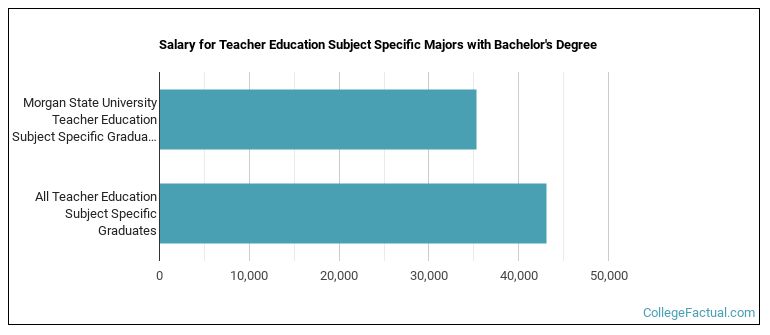
Subject Specific Ed majors who earn their bachelor's degree from Morgan State go on to jobs where they make a median salary of $35,254 a year. Unfortunately, this is lower than the national average of $43,086 for all subject specific ed students.
While getting their bachelor's degree at Morgan State, subject specific ed students borrow a median amount of $30,872 in student loans. This is higher than the the typical median of $26,530 for all subject specific ed majors across the country.
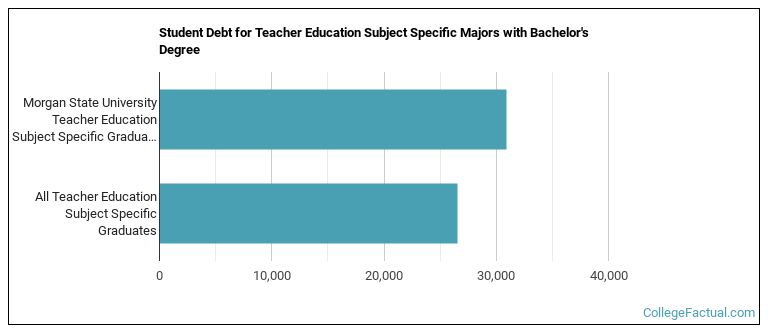
The typical student loan payment of a bachelor's degree student from the subject specific ed program at Morgan State is $143 per month.
Out-of-state part-time undergraduates at Morgan State paid an average of $642 per credit hour in 2022-2023. The average for in-state students was $255 per credit hour. Information about average full-time undergraduate tuition and fees is shown in the table below.
| In State | Out of State | |
|---|---|---|
| Tuition | $5,587 | $18,800 |
| Fees | $2,531 | $2,531 |
| Books and Supplies | $2,000 | $2,000 |
| On Campus Room and Board | $12,755 | $12,755 |
| On Campus Other Expenses | $3,565 | $3,565 |
Learn more about Morgan State tuition and fees.
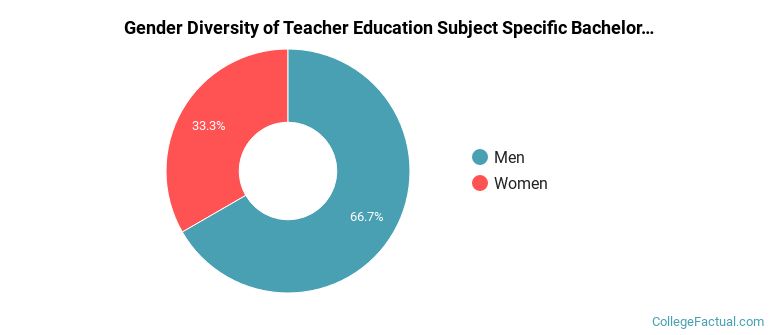
The subject specific ed program at Morgan State awarded 18 bachelor's degrees in 2021-2022. About 67% of these degrees went to men with the other 33% going to women.
The majority of the bachelor's degree graduates for this major are black or African Americans. About 83% of grads fell into this category.
The following table and chart show the ethnic background for students who recently graduated from Morgan State University with a bachelor's in subject specific ed.
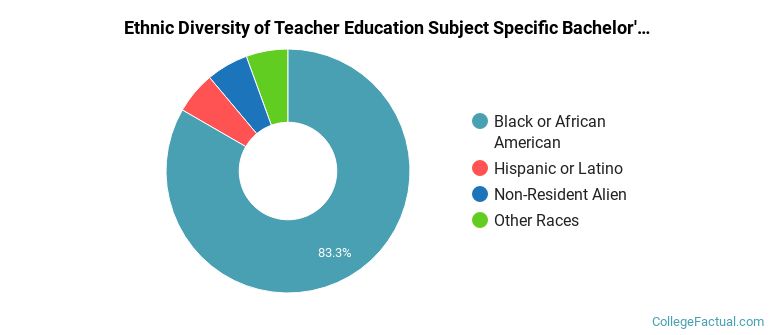
| Ethnic Background | Number of Students |
|---|---|
| Asian | 0 |
| Black or African American | 15 |
| Hispanic or Latino | 1 |
| White | 0 |
| Non-Resident Aliens | 1 |
| Other Races | 1 |
Morgan State does not offer an online option for its subject specific ed bachelor’s degree program at this time. To see if the school offers distance learning options in other areas, visit the Morgan State Online Learning page.
Take a look at the following statistics related to the make-up of the subject specific ed majors at Morgan State University.
| Related Major | Annual Graduates |
|---|---|
| Educational Administration | 41 |
| Teacher Education Grade Specific | 32 |
View All Teacher Education Subject Specific Related Majors >