We've gathered data and other essential information about the program, such as the ethnicity of students, how many students graduated in recent times, and more. In addition, we cover how Morrisville State College ranks in comparison to other schools with plant sciences programs.
Go directly to any of the following sections:
The bachelor's program at Morrisville State College was ranked #35 on College Factual's Best Schools for plant sciences list. It is also ranked #2 in New York.
| Ranking Type | Rank |
|---|---|
| Best Plant Sciences Associate Degree Schools | 3 |
| Best Plant Sciences Schools | 35 |
During the 2021-2022 academic year, Morrisville State College handed out 3 bachelor's degrees in plant sciences. This is a decrease of 50% over the previous year when 6 degrees were handed out.
During the 2022-2023 academic year, part-time undergraduate students at Morrisville State College paid an average of $509 per credit hour if they came to the school from out-of-state. In-state students paid a discounted rate of $295 per credit hour. Information about average full-time undergraduate tuition and fees is shown in the table below.
| In State | Out of State | |
|---|---|---|
| Tuition | $7,070 | $17,490 |
| Fees | $1,699 | $1,699 |
| Books and Supplies | $1,400 | $1,400 |
| On Campus Room and Board | $16,040 | $16,040 |
| On Campus Other Expenses | $1,330 | $1,330 |
Learn more about Morrisville State College tuition and fees.
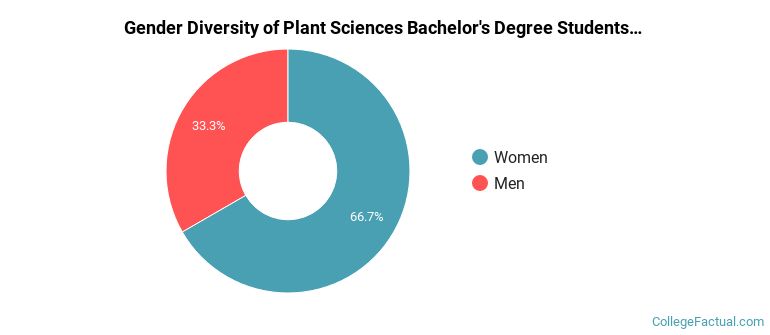
For the most recent academic year available, 33% of plant sciences bachelor's degrees went to men and 67% went to women.
The majority of the students with this major are white. About 100% of 2022 graduates were in this category.
The following table and chart show the ethnic background for students who recently graduated from Morrisville State College with a bachelor's in plant sciences.

| Ethnic Background | Number of Students |
|---|---|
| Asian | 0 |
| Black or African American | 0 |
| Hispanic or Latino | 0 |
| White | 3 |
| Non-Resident Aliens | 0 |
| Other Races | 0 |
Morrisville State College does not offer an online option for its plant sciences bachelor’s degree program at this time. To see if the school offers distance learning options in other areas, visit the Morrisville State College Online Learning page.
In the 2021-2022 academic year, 9 students earned a associate's degree in plant sciences from Morrisville State College. About 67% of these graduates were women and the other 33% were men.

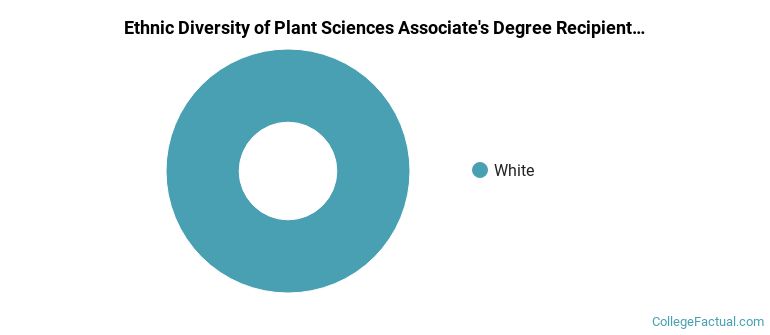
The majority of the students with this major are white. About 100% of 2022 graduates were in this category.
The following table and chart show the ethnic background for students who recently graduated from Morrisville State College with a associate's in plant sciences.
| Ethnic Background | Number of Students |
|---|---|
| Asian | 0 |
| Black or African American | 0 |
| Hispanic or Latino | 0 |
| White | 9 |
| Non-Resident Aliens | 0 |
| Other Races | 0 |
Take a look at the following statistics related to the make-up of the plant sciences majors at Morrisville State College.
| Related Major | Annual Graduates |
|---|---|
| Animal Services | 28 |
| Agricultural Economics & Business | 27 |
| Agricultural Production | 26 |
| General Agriculture | 5 |
| Agricultural Mechanization | 3 |