Explore the best ranked schools for the programs you are most interested in.
According to College Factual's 2025 analysis, UMO is ranked #1,461 out of 2,152 schools in the nation that were analyzed for overall quality. This is an improvement over the previous year, when UMO held the #1,940 spot on the Best Overall Colleges list.
Out of the 93 colleges in North Carolina, UMO is ranked at #46.
When it comes to admittance, University of Mount Olive is somewhat selective. Its acceptance rate is 75%, which means you'll face some strong competition during the admissions process. Do what you can to make your application stand out.
The student to faculty ratio at University of Mount Olive is about average at 16 to 1. This ratio is often used to gauge how many students might be in an average class and how much time professors will have to spend with their students on an individual level. The national average for this metric is 15 to 1.
Another measure that is often used to estimate how much access students will have to their professors is how many faculty members are full-time. The idea here is that part-time faculty tend to spend less time on campus, so they may not be as available to students as full-timers.
The full-time faculty percentage at University of Mount Olive is 100%. This is higher than the national average of 47%.
The freshmen retention rate tells us what percentage of first-year, full-time students choose to continue on to their sophomore year at a particular school. The rate at University of Mount Olive is 63%, which is about average when compared to the national rate of 68%.
The on-time graduation rate is the percent of first-time, full-time students who get their bachelor's degree with four years. At UMO this rate is 37%, which is about average when compared to the national rate of 33.3%.
Find out more about the retention and graduation rates at University of Mount Olive.
During the 2017-2018 academic year, there were 2,350 undergraduates at UMO with 1,348 being full-time and 1,002 being part-time.
| $0-30 K | $30K-48K | $48-75 | $75-110K | $110K + |
|---|---|---|---|---|
| $15,882 | $16,723 | $14,592 | $17,369 | $19,714 |
The net price is calculated by adding tuition, room, board and other costs and subtracting financial aid.Note that the net price is typically less than the published for a school. For more information on the sticker price of UMO, see our tuition and fees and room and board pages.
It's not uncommon for college students to take out loans to pay for school. In fact, almost 66% of students nationwide depend at least partially on loans. At UMO, approximately 73% of students took out student loans averaging $6,240 a year. That adds up to $24,960 over four years for those students.
Get more details about paying for University of Mount Olive.
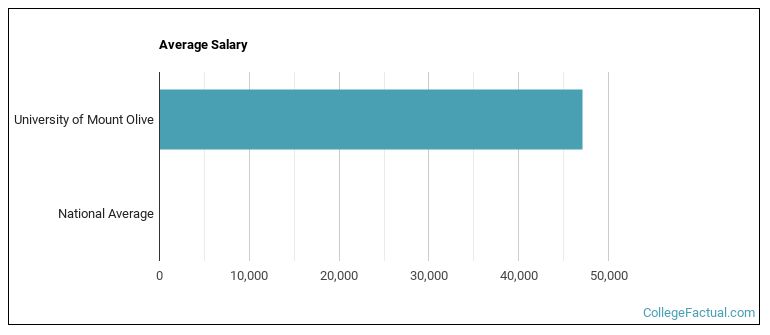
See which majors at University of Mount Olive make the most money.
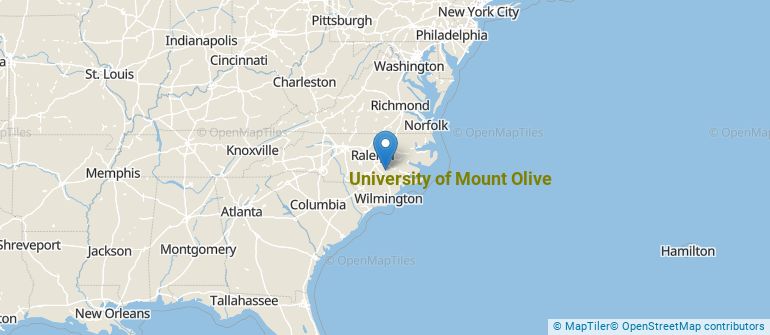
Get more details about the location of University of Mount Olive.
Contact details for UMO are given below.
| Contact Details | |
|---|---|
| Address: | 634 Henderson St, Mount Olive, NC 28365-0919 |
| Phone: | 919-658-2502 |
| Website: | https://umo.edu/ |
| Facebook: | https://www.facebook.com/universityofmountolive |
| Twitter: | https://twitter.com/OfficialUMO |
| Most Popular Majors | Bachelor’s Degrees | Average Salary of Graduates |
|---|---|---|
| Business Administration & Management | 141 | $48,751 |
| Teacher Education Grade Specific | 65 | $37,409 |
| Liberal Arts General Studies | 53 | NA |
| Health & Medical Administrative Services | 42 | $43,807 |
| Criminal Justice & Corrections | 40 | $40,639 |
| Health & Physical Education | 31 | $27,413 |
| Nursing | 25 | $81,493 |
| Agricultural Economics & Business | 22 | NA |
| Accounting | 22 | $42,962 |
| Human Resource Management | 22 | $40,860 |
Online learning is becoming popular at even the oldest colleges and universities in the United States. Not only are online classes great for returning adults with busy schedules, they are also frequented by a growing number of traditional students.
In 2022-2023, 1,634 students took at least one online class at University of Mount Olive. This is a decrease from the 1,774 students who took online classes the previous year.
| Year | Took at Least One Online Class | Took All Classes Online |
|---|---|---|
| 2022-2023 | 1,634 | 1,247 |
| 2021-2022 | 1,774 | 1,298 |
| 2020-2021 | 2,198 | 1,457 |
| 2018-2019 | 1,999 | 497 |
Learn more about online learning at University of Mount Olive.
If you’re considering University of Mount Olive, here are some more schools you may be interested in knowing more about.
Curious on how these schools stack up against UMO? Pit them head to head with College Combat, our free interactive tool that lets you compare college on the features that matter most to you!
Footnotes
*The racial-ethnic minorities count is calculated by taking the total number of students and subtracting white students, international students, and students whose race/ethnicity was unknown. This number is then divided by the total number of students at the school to obtain the racial-ethnic minorities percentage.
References
More about our data sources and methodologies.