Jump to any of the following sections:
The education major at MSMU is not ranked on College Factual’s Best Colleges and Universities for Education. This could be for a number of reasons, such as not having enough data on the major or school to make an accurate assessment of its quality.
During the 2021-2022 academic year, Mount Saint Mary's University handed out 6 bachelor's degrees in education. This is a decrease of 80% over the previous year when 30 degrees were handed out.
In 2022, 22 students received their master’s degree in education from MSMU. This makes it the #824 most popular school for education master’s degree candidates in the country.
During the 2022-2023 academic year, part-time undergraduate students at MSMU paid an average of $1,947 per credit hour. No discount was available for in-state students. The following table shows the average full-time tuition and fees for undergraduates.
| In State | Out of State | |
|---|---|---|
| Tuition | $46,726 | $46,726 |
| Fees | $1,406 | $1,406 |
| Books and Supplies | $2,434 | $2,434 |
| On Campus Room and Board | $14,154 | $14,154 |
| On Campus Other Expenses | $6,970 | $6,970 |
Learn more about MSMU tuition and fees.
All of the 6 students who graduated with a Bachelor’s in education from MSMU in 2022 were women.

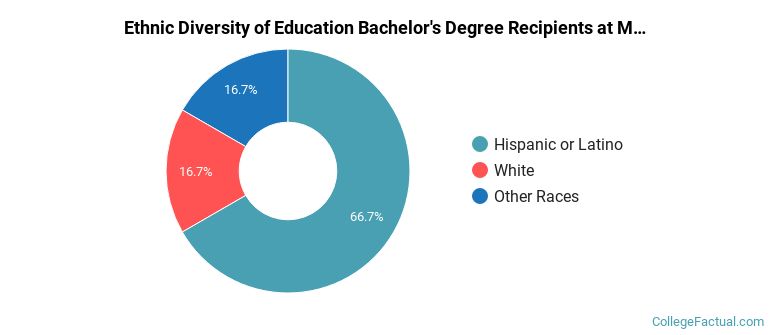
The majority of the bachelor's degree graduates for this major are Hispanic or Latino. In the most recent graduating class for which data is available, 67% of grads fell into this category.
The following table and chart show the ethnic background for students who recently graduated from Mount Saint Mary's University with a bachelor's in education.
| Ethnic Background | Number of Students |
|---|---|
| Asian | 0 |
| Black or African American | 0 |
| Hispanic or Latino | 4 |
| White | 1 |
| Non-Resident Aliens | 0 |
| Other Races | 1 |
Online degrees for the MSMU education bachelor’s degree program are not available at this time. To see if the school offers distance learning options in other areas, visit the MSMU Online Learning page.
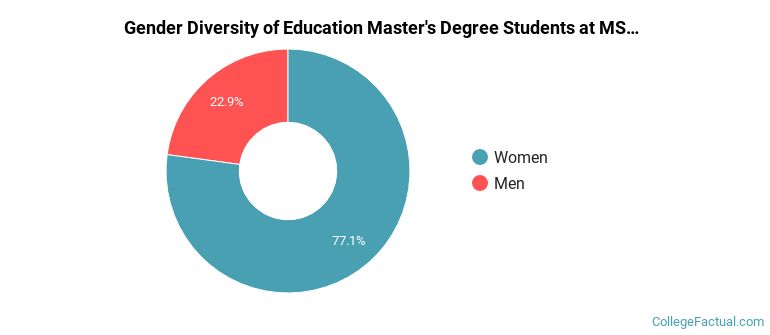
During the 2021-2022 academic year, 35 students graduated with a master's degree in education from MSMU. About 23% were men and 77% were women.
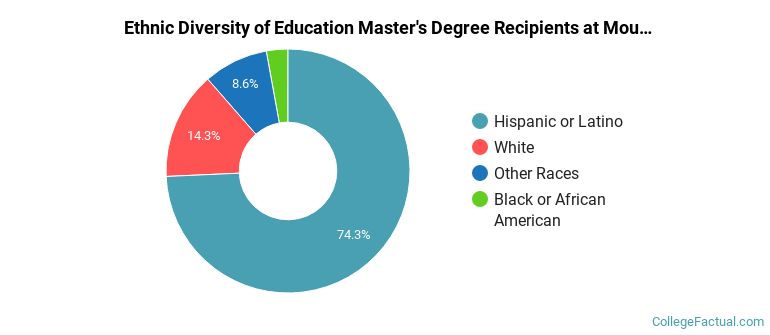
The majority of the master's degree graduates for this major are Hispanic or Latino. In the most recent graduating class for which data is available, 74% of grads fell into this category.
The following table and chart show the ethnic background for students who recently graduated from Mount Saint Mary's University with a master's in education.
| Ethnic Background | Number of Students |
|---|---|
| Asian | 0 |
| Black or African American | 1 |
| Hispanic or Latino | 26 |
| White | 5 |
| Non-Resident Aliens | 0 |
| Other Races | 3 |
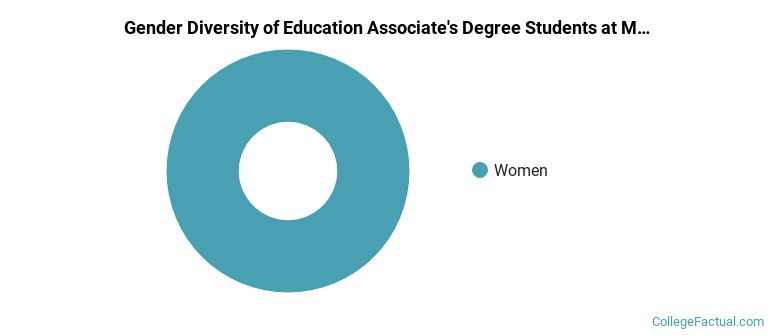
All of the 2 students who graduated with a Associate’s in education from MSMU in 2022 were women.
The following table and chart show the ethnic background for students who recently graduated from Mount Saint Mary's University with a associate's in education.
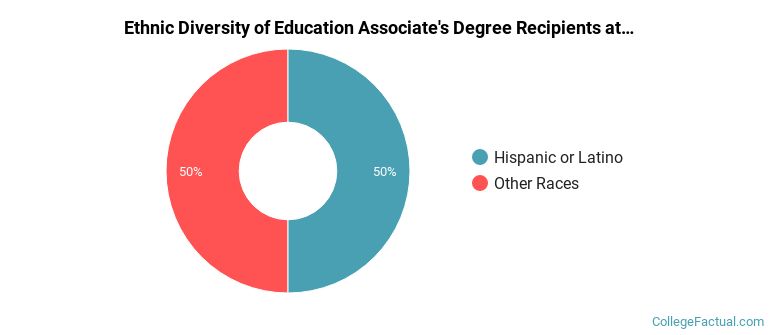
| Ethnic Background | Number of Students |
|---|---|
| Asian | 0 |
| Black or African American | 0 |
| Hispanic or Latino | 1 |
| White | 0 |
| Non-Resident Aliens | 0 |
| Other Races | 1 |
Take a look at the following statistics related to the make-up of the education majors at Mount Saint Mary’s University.
Education students may decide to major in one of the following focus areas. Individual majors may not be available for all degree levels.
| Major | Annual Graduates |
|---|---|
| General Education | 30 |
| Special Education | 10 |
| Teacher Education Grade Specific | 2 |
| Educational Administration | 1 |
More about our data sources and methodologies.