Jump to any of the following sections:
The social sciences major at Napa Valley College is not ranked on College Factual’s Best Colleges and Universities for Social Sciences. This could be for a number of reasons, such as not having enough data on the major or school to make an accurate assessment of its quality.
Out-of-state part-time undergraduates at Napa Valley College paid an average of $494 per credit hour in 2022-2023. The average for in-state students was $46 per credit hour. The average full-time tuition and fees for undergraduates are shown in the table below.
| In State | Out of State | |
|---|---|---|
| Tuition | $1,104 | $11,856 |
| Fees | $52 | $52 |
| Books and Supplies | $938 | $938 |
Learn more about Napa Valley College tuition and fees.
Online degrees for the Napa Valley College social sciences bachelor’s degree program are not available at this time. To see if the school offers distance learning options in other areas, visit the Napa Valley College Online Learning page.
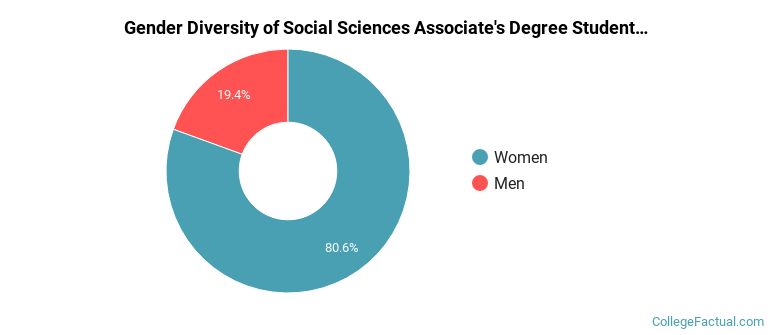
Of the 36 social sciences students who graduated with a associate's degree in 2021-2022 from Napa Valley College, about 19% were men and 81% were women.
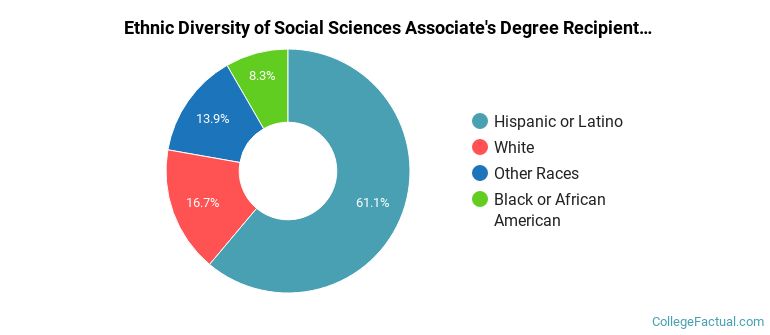
The majority of the associate's degree graduates for this major are Hispanic or Latino. In the most recent graduating class for which data is available, 61% of grads fell into this category.
The following table and chart show the ethnic background for students who recently graduated from Napa Valley College with a associate's in social sciences.
| Ethnic Background | Number of Students |
|---|---|
| Asian | 0 |
| Black or African American | 3 |
| Hispanic or Latino | 22 |
| White | 6 |
| Non-Resident Aliens | 0 |
| Other Races | 5 |
Social Sciences students may decide to major in one of the following focus areas. Individual majors may not be available for all degree levels.
| Major | Annual Graduates |
|---|---|
| Sociology | 24 |
| Political Science & Government | 8 |
| Other Social Sciences | 2 |
| General Social Sciences | 1 |
| Anthropology | 1 |
| Related Major | Annual Graduates |
|---|---|
| Liberal Arts / Sciences & Humanities | 372 |
| Communication & Journalism | 24 |
| Family, Consumer & Human Sciences | 17 |
| History | 9 |
| Area, Ethnic, Culture, & Gender Studies | 7 |