
College Factual recognizes the best colleges and universities in its annual rankings. These rankings include categories for best overall colleges, best colleges for each major, best value schools, and much more.
National Louis University was awarded 67 badges in the 2025 rankings. The highest ranked major at the school is teacher education grade specific.
Explore the best ranked schools for the programs you are most interested in.
NLU landed the #385 spot in College Factual's 2025 ranking of best overall colleges in the United States. The higher ed experts analyzed 2,152 colleges and universities across the nation to determine this ranking. This puts it in the top 20% of all schools in the nation. This is an improvement over the previous year, when NLU held the #393 spot on the Best Overall Colleges list.
NLU is also ranked #12 out of 85 schools in Illinois.
With an acceptance rate of 92%, National Louis University is easier to get into than many other schools. But that doesn't mean you can slack off on your application. Make sure to treat this school like any other when submitting requested materials and documents.
The student to faculty ratio at National Louis University is about average at 15 to 1. This ratio is often used to gauge how many students might be in an average class and how much time professors will have to spend with their students on an individual level. The national average for this metric is 15 to 1.
In addition to the student to faculty ratio, some people look at what percentage of faculty members are full-time as a sign of how much time professors will be able to spend with their students. This is because part-time teachers may not be be on campus as much as their full-time counterparts.
The full-time faculty percentage at National Louis University is 100%. This is higher than the national average of 47%.
The freshmen retention rate is a sign of how many full-time students like a college or university well enough to come back for their sophomore year. At National Louis University this rate is 61%, which is a bit lower than the national average of 68%.
The on-time graduation rate is the percent of first-time, full time students who obtain their bachelor's degree in four years or less. This rate is 11% for first-time, full-time students at NLU, which is lower than the national rate of 33.3%.
Find out more about the retention and graduation rates at National Louis University.
During the 2017-2018 academic year, there were 3,604 undergraduates at NLU with 2,564 being full-time and 1,040 being part-time.
| $0-30 K | $30K-48K | $48-75 | $75-110K | $110K + |
|---|---|---|---|---|
| $13,834 | $13,408 | $15,754 | $17,147 | $21,221 |
The net price is calculated by adding tuition, room, board and other costs and subtracting financial aid.Note that the net price is typically less than the published for a school. For more information on the sticker price of NLU, see our tuition and fees and room and board pages.
Almost 66% of college students who graduated with the class of 2018 took out student loans, but that percentage varies from school to school. At NLU, approximately 12% of students took out student loans averaging $5,157 a year. That adds up to $20,628 over four years for those students.
Get more details about paying for National Louis University.
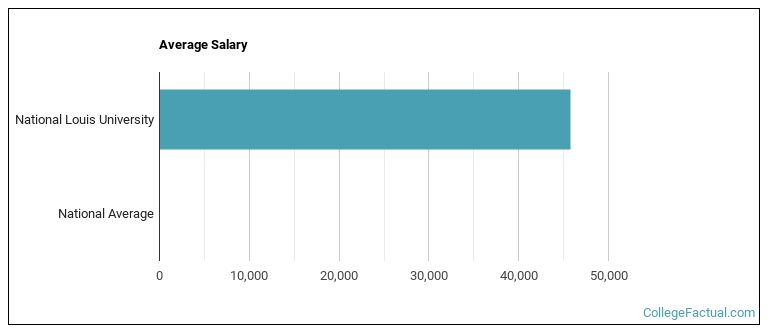
See which majors at National Louis University make the most money.
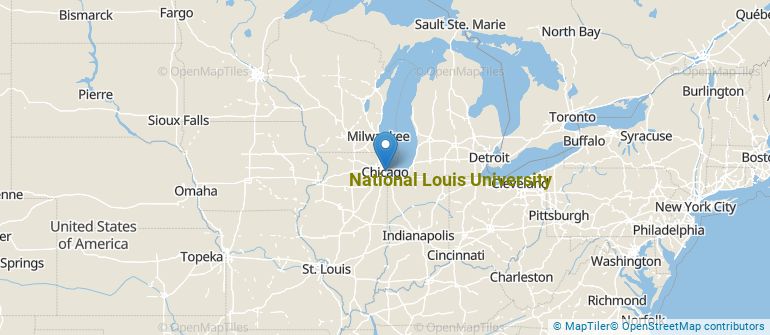
Get more details about the location of National Louis University.
Contact details for NLU are given below.
| Contact Details | |
|---|---|
| Address: | 122 S Michigan Ave, Chicago, IL 60603 |
| Phone: | 800-443-5522 |
| Website: | www.nl.edu/ |
| Most Popular Majors | Bachelor’s Degrees | Average Salary of Graduates |
|---|---|---|
| Teacher Education Grade Specific | 602 | $40,484 |
| Clinical, Counseling & Applied Psychology | 210 | NA |
| Curriculum & Instruction | 192 | NA |
| Educational Administration | 174 | NA |
| Business Administration & Management | 120 | $45,096 |
| Human Development & Family Studies | 113 | $46,954 |
| Health & Medical Administrative Services | 106 | $46,203 |
| Culinary Arts | 93 | NA |
| General Psychology | 93 | $35,798 |
| Special Education | 84 | NA |
Online learning options are becoming more and more popular at American colleges and universities. Online classes are great for students who have busy schedules or for those who just want to study on their own time.
In 2022-2023, 5,125 students took at least one online class at National Louis University. This is an increase from the 4,387 students who took online classes the previous year.
| Year | Took at Least One Online Class | Took All Classes Online |
|---|---|---|
| 2022-2023 | 5,125 | 3,948 |
| 2021-2022 | 4,387 | 3,197 |
| 2020-2021 | 4,054 | 2,531 |
| 2018-2019 | 3,432 | 1,946 |
Learn more about online learning at National Louis University.
Footnotes
*The racial-ethnic minorities count is calculated by taking the total number of students and subtracting white students, international students, and students whose race/ethnicity was unknown. This number is then divided by the total number of students at the school to obtain the racial-ethnic minorities percentage.
References
More about our data sources and methodologies.