Here, you'll find out more about the major, including such details as the number of graduates, what degree levels are offered, ethnicity of students, and more. Also, learn how National University ranks among other schools offering degrees in special ed.
Jump to any of the following sections:
National University is in the top 10% of the country for special ed. More specifically it was ranked #28 out of 353 schools by College Factual. It is also ranked #2 in California.
| Ranking Type | Rank |
|---|---|
| Best Special Education Master’s Degree Schools | 22 |
| Best Special Education Graduate Degree Schools | 24 |
| Best Special Education Schools | 28 |
During the 2021-2022 academic year, National University handed out 3 bachelor's degrees in special education. Last year, the same number of degrees were handed out.
In 2022, 431 students received their master’s degree in special ed from National University. This makes it the #5 most popular school for special ed master’s degree candidates in the country.
Part-time undergraduates at National University paid an average of $370 per credit hour in 2022-2023. This tuition was the same for both in-state and out-of-state students. The following table shows the average full-time tuition and fees for undergraduates.
| In State | Out of State | |
|---|---|---|
| Tuition | $13,320 | $13,320 |
| Books and Supplies | $938 | $938 |
Learn more about National University tuition and fees.
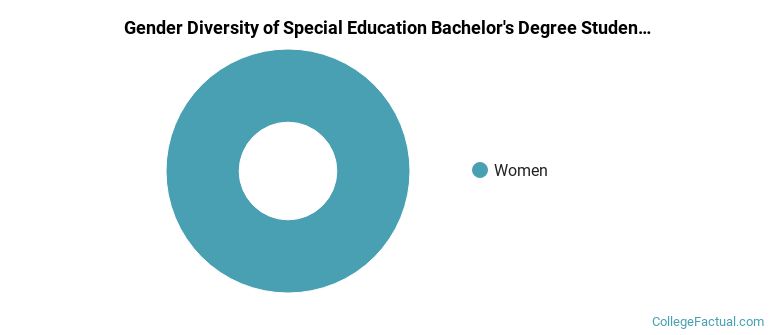
All of the 3 students who graduated with a Bachelor’s in special ed from National University in 2022 were women.
The following table and chart show the ethnic background for students who recently graduated from National University with a bachelor's in special ed.
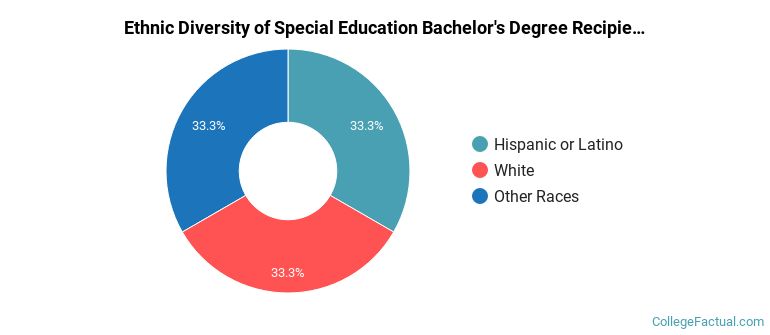
| Ethnic Background | Number of Students |
|---|---|
| Asian | 0 |
| Black or African American | 0 |
| Hispanic or Latino | 1 |
| White | 1 |
| Non-Resident Aliens | 0 |
| Other Races | 1 |
National University does not offer an online option for its special ed bachelor’s degree program at this time. To see if the school offers distance learning options in other areas, visit the National University Online Learning page.
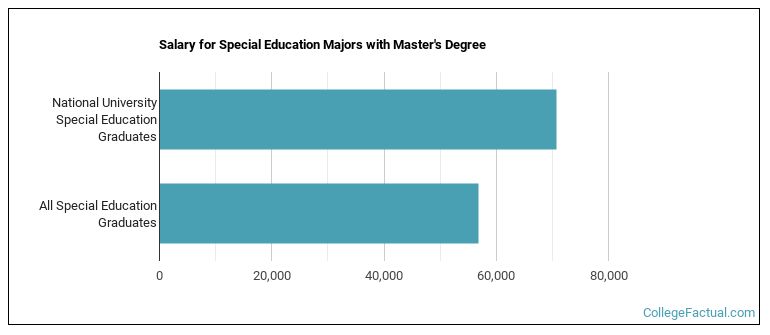
Special Ed majors graduating with a master's degree from National University make a median salary of $70,672 a year. This is a better than average outcome since the median salary for all special ed graduates with a master's is $56,864.
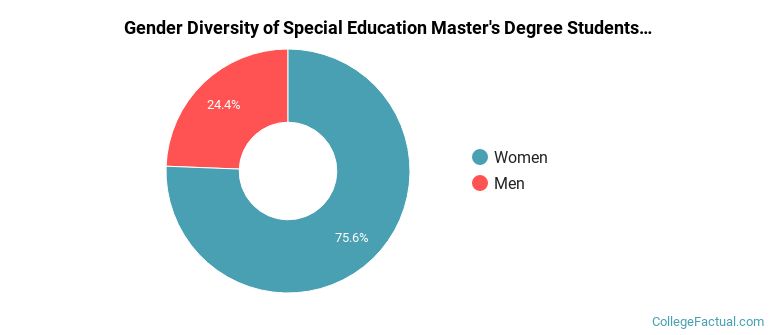
Of the 361 students who earned a master's degree in Special Education from National University in 2021-2022, 24% were men and 76% were women.
The following table and chart show the ethnic background for students who recently graduated from National University with a master's in special ed.
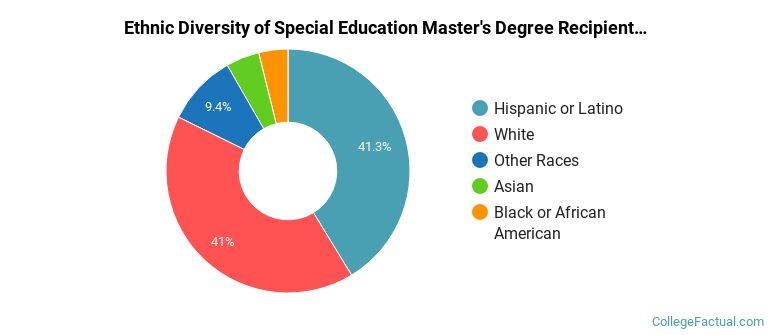
| Ethnic Background | Number of Students |
|---|---|
| Asian | 16 |
| Black or African American | 14 |
| Hispanic or Latino | 149 |
| White | 148 |
| Non-Resident Aliens | 0 |
| Other Races | 34 |
Take a look at the following statistics related to the make-up of the special ed majors at National University.
| Related Major | Annual Graduates |
|---|---|
| General Education | 944 |
| Student Counseling | 207 |
| Educational Administration | 180 |
| Teacher Education Grade Specific | 170 |
| Educational Assessment | 98 |
More about our data sources and methodologies.