College Factual recognizes the best colleges and universities in its annual rankings. These rankings include categories for best overall colleges, best colleges for each major, best value schools, and much more.
Neumann University was awarded 6 badges in the 2025 rankings. The highest ranked major at the school is other homeland security.
Explore the best ranked schools for the programs you are most interested in.
Neumann is ranked #1,095 out of 2,152 schools in the nation for overall quality on College Factual's 2025 Best Colleges list. This is an improvement over the previous year, when Neumann held the #1,356 spot on the Best Overall Colleges list.
Out of the 103 colleges in Pennsylvania, Neumann is ranked at #62.
Because it has a high acceptance rate of 85%, some consider Neumann to be a safety school. But don't just assume that admittance is in the bag. Make sure to spend enough time on your application so that it is in tip-top shape.
With a student to faculty ratio of 13 to 1, Neumann University is about average in this regard as the nationwide rate is 15 to 1. While this does not translate directly to class size, it's a good indicator of how much time professors will have to spend with their students on a one-on-one basis.
In addition to the student to faculty ratio, some people look at what percentage of faculty members are full-time as a sign of how much time professors will be able to spend with their students. This is because part-time teachers may not be be on campus as much as their full-time counterparts.
The full-time faculty percentage at Neumann University is 37%. This is lower than the national average of 47%.
The freshmen retention rate tells us what percentage of first-year, full-time students choose to continue on to their sophomore year at a particular school. The rate at Neumann University is 71%, which is about average when compared to the national rate of 68%.
The on-time graduation rate is the percent of first-time, full-time students who get their bachelor's degree with four years. At Neumann this rate is 31%, which is about average when compared to the national rate of 33.3%.
Find out more about the retention and graduation rates at Neumann University.
During the 2017-2018 academic year, there were 1,942 undergraduates at Neumann with 1,441 being full-time and 501 being part-time.
| $0-30 K | $30K-48K | $48-75 | $75-110K | $110K + |
|---|---|---|---|---|
| $26,145 | $24,759 | $25,257 | $30,930 | $33,844 |
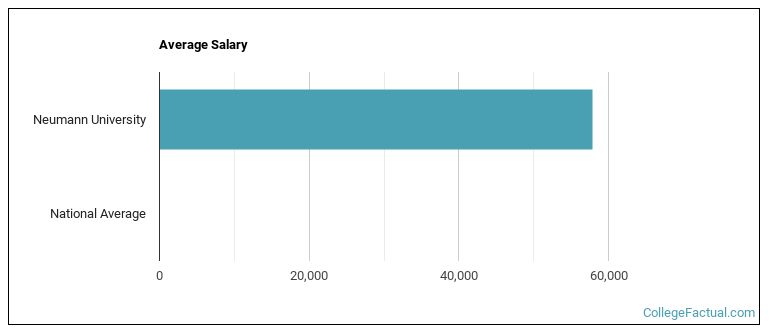
The net price is calculated by adding tuition, room, board and other costs and subtracting financial aid.Note that the net price is typically less than the published for a school. For more information on the sticker price of Neumann, see our tuition and fees and room and board pages.
Almost 66% of college students who graduated with the class of 2018 took out student loans, but that percentage varies from school to school. At Neumann, approximately 82% of students took out student loans averaging $7,396 a year. That adds up to $29,584 over four years for those students.
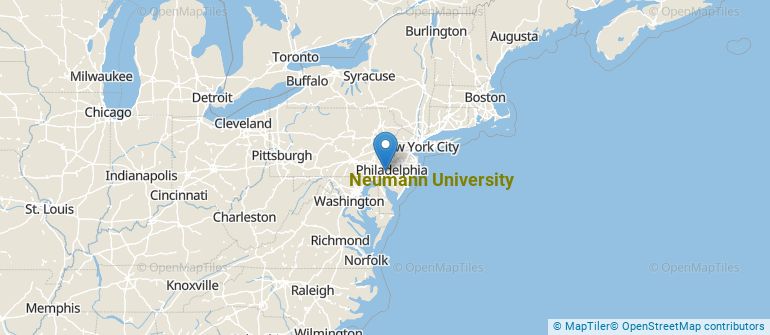
Get more details about the location of Neumann University.
Contact details for Neumann are given below.
| Contact Details | |
|---|---|
| Address: | One Neumann Drive, Aston, PA 19014-1298 |
| Phone: | 610-459-0905 |
| Website: | www.neumann.edu/ |
| Most Popular Majors | Bachelor’s Degrees | Average Salary of Graduates |
|---|---|---|
| Nursing | 70 | $82,238 |
| Liberal Arts General Studies | 55 | $35,220 |
| Educational Administration | 50 | NA |
| Special Education | 45 | $42,488 |
| Other Homeland Security | 38 | $125,391 |
| Rehabilitation & Therapeutic Professions | 31 | NA |
| Communication & Media Studies | 26 | $32,386 |
| Business Administration & Management | 23 | $41,693 |
| Health/Medical Prep Programs | 23 | NA |
| General Psychology | 22 | NA |
Online learning options are becoming more and more popular at American colleges and universities. Online classes are great for students who have busy schedules or for those who just want to study on their own time.
In 2022-2023, 1,126 students took at least one online class at Neumann University. This is a decrease from the 1,570 students who took online classes the previous year.
| Year | Took at Least One Online Class | Took All Classes Online |
|---|---|---|
| 2022-2023 | 1,126 | 225 |
| 2021-2022 | 1,570 | 239 |
| 2020-2021 | 2,198 | 801 |
| 2018-2019 | 638 | 254 |
If you’re considering Neumann University, here are some more schools you may be interested in knowing more about.
Curious on how these schools stack up against Neumann? Pit them head to head with College Combat, our free interactive tool that lets you compare college on the features that matter most to you!
Footnotes
*The racial-ethnic minorities count is calculated by taking the total number of students and subtracting white students, international students, and students whose race/ethnicity was unknown. This number is then divided by the total number of students at the school to obtain the racial-ethnic minorities percentage.
References
More about our data sources and methodologies.