Explore the best ranked schools for the programs you are most interested in.
New Mexico Junior College landed the #2,065 spot in College Factual's 2025 ranking of best overall colleges in the United States. The higher ed experts analyzed 2,152 colleges and universities across the nation to determine this ranking.
New Mexico Junior College is also ranked #20 out of 24 schools in New Mexico.
If you are worried about getting into New Mexico Junior College, don't be. The school has a liberal open admissions policy, which means you only need to meet basic requirements in order to be admitted. Still, be sure to submit a complete application and provide any other requested materials.
The student to faculty ratio at New Mexico Junior College is about average at 17 to 1. This ratio is often used to gauge how many students might be in an average class and how much time professors will have to spend with their students on an individual level. The national average for this metric is 15 to 1.
In addition to the student to faculty ratio, some people look at what percentage of faculty members are full-time as a sign of how much time professors will be able to spend with their students. This is because part-time teachers may not be be on campus as much as their full-time counterparts.
The full-time faculty percentage at New Mexico Junior College is 100%. This is higher than the national average of 47%.
The freshmen retention rate is a sign of how many full-time students like a college or university well enough to come back for their sophomore year. At New Mexico Junior College this rate is 55%, which is a bit lower than the national average of 68%.
During the 2017-2018 academic year, there were 1,406 undergraduates at New Mexico Junior College with 735 being full-time and 671 being part-time.
| $0-30 K | $30K-48K | $48-75 | $75-110K | $110K + |
|---|---|---|---|---|
| $5,789 | $5,834 | $7,310 | $7,994 | $8,755 |
The net price is calculated by adding tuition, room, board and other costs and subtracting financial aid.Note that the net price is typically less than the published for a school. For more information on the sticker price of New Mexico Junior College, see our tuition and fees and room and board pages.
Almost 66% of college students who graduated with the class of 2018 took out student loans, but that percentage varies from school to school. At New Mexico Junior College, approximately 4% of students took out student loans averaging $2,926 a year. That adds up to $11,704 over four years for those students.
Get more details about paying for New Mexico Junior College.
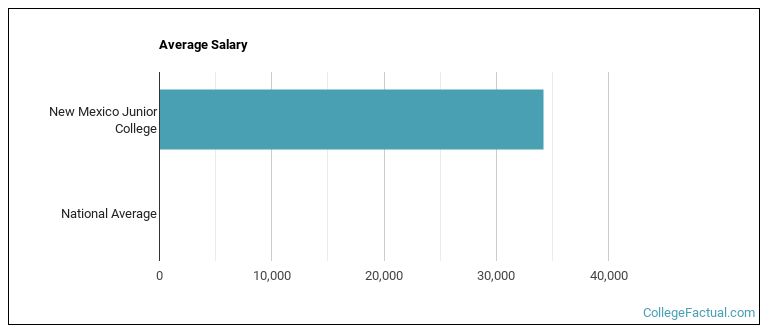
See which majors at New Mexico Junior College make the most money.
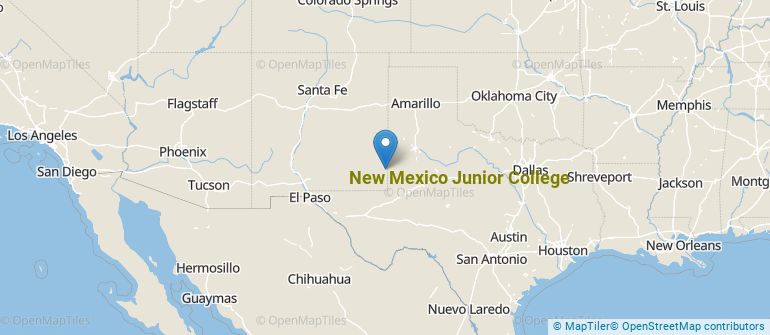
Get more details about the location of New Mexico Junior College.
Contact details for New Mexico Junior College are given below.
| Contact Details | |
|---|---|
| Address: | 5317 Lovington Hwy, Hobbs, NM 88240 |
| Phone: | 575-392-4510 |
| Website: | www.nmjc.edu/ |
| Most Popular Majors | Bachelor’s Degrees | Average Salary of Graduates |
|---|---|---|
| Liberal Arts General Studies | 236 | NA |
| Criminal Justice & Corrections | 46 | NA |
| Cosmetology | 44 | NA |
| Nursing | 32 | NA |
| Vehicle Maintenance & Repair | 11 | NA |
| Business Administration & Management | 9 | NA |
| Precision Metal Working | 7 | NA |
| Teacher Education Grade Specific | 6 | NA |
| Practical Nursing & Nursing Assistants | 5 | NA |
| Computer Information Systems | 3 | NA |
Online learning options are becoming more and more popular at American colleges and universities. Online classes are great for students who have busy schedules or for those who just want to study on their own time.
In 2022-2023, 1,475 students took at least one online class at New Mexico Junior College. This is an increase from the 1,380 students who took online classes the previous year.
| Year | Took at Least One Online Class | Took All Classes Online |
|---|---|---|
| 2022-2023 | 1,475 | 98 |
| 2021-2022 | 1,380 | 74 |
| 2020-2021 | 1,134 | 160 |
| 2018-2019 | 2,247 | 295 |
Learn more about online learning at New Mexico Junior College.
Footnotes
*The racial-ethnic minorities count is calculated by taking the total number of students and subtracting white students, international students, and students whose race/ethnicity was unknown. This number is then divided by the total number of students at the school to obtain the racial-ethnic minorities percentage.
References
More about our data sources and methodologies.