Explore the best ranked schools for the programs you are most interested in.
Newschool of Architecture and Design was not ranked in College Factual's 2025 Best Overall Colleges report. This could be for a number of reasons, including lack of data.
See all of the rankings for Newschool of Architecture and Design.
Newschool of Architecture and Design has an acceptance rate of 45%, which means the school is serious about who it admits. Take your time in putting together a strong application that highlights why you are a good fit for Newschool of Architecture and Design.
The student to faculty ratio at Newschool of Architecture and Design is an impressive 6 to 1. That's quite good when you compare it to the national average of 15 to 1. This is a good sign that students at the school will have more opportunities for one-on-one interactions with their professors.
When estimating how much access students will have to their teachers, some people like to look at what percentage of faculty members are full time. This is because part-time teachers may not have as much time to spend on campus as their full-time counterparts.
The full-time faculty percentage at Newschool of Architecture and Design is 21%. This is lower than the national average of 47%.
The freshmen retention rate tells us what percentage of first-year, full-time students choose to continue on to their sophomore year at a particular school. The rate at Newschool of Architecture and Design is 64%, which is about average when compared to the national rate of 68%.
When we say that a student has graduated on time, we mean that they have finished their bachelor's degree within four years. The on-time graduation rate at Newschool of Architecture and Design is 6%. That's lower than the national rate of 33.3%
Find out more about the retention and graduation rates at Newschool of Architecture and Design.
During the 2017-2018 academic year, there were 359 undergraduates at Newschool of Architecture and Design with 324 being full-time and 35 being part-time.
The net price is calculated by adding tuition, room, board and other costs and subtracting financial aid.Note that the net price is typically less than the published for a school. For more information on the sticker price of Newschool of Architecture and Design, see our tuition and fees and room and board pages.
While almost two-thirds of students nationwide take out loans to pay for college, the percentage may be quite different for the school you plan on attending. At Newschool of Architecture and Design, approximately 64% of students took out student loans averaging $9,343 a year. That adds up to $37,372 over four years for those students.
Get more details about paying for Newschool of Architecture and Design.
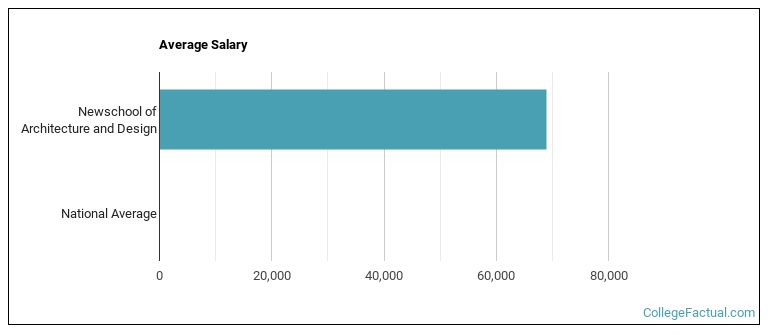
See which majors at Newschool of Architecture and Design make the most money.
Get more details about the location of Newschool of Architecture and Design.

Contact details for Newschool of Architecture and Design are given below.
| Contact Details | |
|---|---|
| Address: | 1249 F St, San Diego, CA 92101 |
| Phone: | 800-490-7081 |
| Website: | www.newschoolarch.edu/ |
| Most Popular Majors | Bachelor’s Degrees | Average Salary of Graduates |
|---|---|---|
| Architectural Sciences & Technology | 116 | NA |
| Construction Management | 43 | NA |
| Design & Applied Arts | 29 | $37,132 |
| Graphic Communications | 7 | NA |
Online courses area a great option for busy, working students as well as for those who have scheduling conflicts and want to study on their own time. As time goes by, expect to see more and more online learning options become available.
In 2022-2023, 58 students took at least one online class at Newschool of Architecture and Design. This is a decrease from the 77 students who took online classes the previous year.
| Year | Took at Least One Online Class | Took All Classes Online |
|---|---|---|
| 2022-2023 | 58 | 13 |
| 2021-2022 | 77 | 20 |
| 2020-2021 | 455 | 455 |
| 2018-2019 | 55 | 52 |
Learn more about online learning at Newschool of Architecture and Design.
Footnotes
*The racial-ethnic minorities count is calculated by taking the total number of students and subtracting white students, international students, and students whose race/ethnicity was unknown. This number is then divided by the total number of students at the school to obtain the racial-ethnic minorities percentage.
References
More about our data sources and methodologies.