Explore the best ranked schools for the programs you are most interested in.
Norfolk State was not ranked in College Factual's 2025 Best Overall Colleges report. This could be for a number of reasons, including lack of data.
The acceptance rate at Norfolk State University is 89%, which is higher than many other schools to which you may be applying. But don't think getting into Norfolk State is a sure thing. The admissions staff is still going to review your application to see if you are a good fit for the school.
About 16% of students accepted to Norfolk State submitted their SAT scores. When looking at the 25th through the 75th percentile, SAT Evidence-Based Reading and Writing scores ranged between 430 and 530. Math scores were between 410 and 510.
With a student to faculty ratio of 18 to 1, Norfolk State University is about average in this regard as the nationwide rate is 15 to 1. While this does not translate directly to class size, it's a good indicator of how much time professors will have to spend with their students on a one-on-one basis.
Another measure that is often used to estimate how much access students will have to their professors is how many faculty members are full-time. The idea here is that part-time faculty tend to spend less time on campus, so they may not be as available to students as full-timers.
The full-time faculty percentage at Norfolk State University is 68%. This is higher than the national average of 47%.
The freshmen retention rate tells us what percentage of first-year, full-time students choose to continue on to their sophomore year at a particular school. The rate at Norfolk State University is 70%, which is about average when compared to the national rate of 68%.
When we say that a student has graduated on time, we mean that they have finished their bachelor's degree within four years. The on-time graduation rate at Norfolk State is 17%. That's lower than the national rate of 33.3%
Find out more about the retention and graduation rates at Norfolk State University.
During the 2017-2018 academic year, there were 4,992 undergraduates at Norfolk State with 4,529 being full-time and 463 being part-time.
| $0-30 K | $30K-48K | $48-75 | $75-110K | $110K + |
|---|---|---|---|---|
| $15,660 | $14,364 | $14,220 | $17,198 | $19,508 |
The net price is calculated by adding tuition, room, board and other costs and subtracting financial aid.Note that the net price is typically less than the published for a school. For more information on the sticker price of Norfolk State, see our tuition and fees and room and board pages.
It's not uncommon for college students to take out loans to pay for school. In fact, almost 66% of students nationwide depend at least partially on loans. At Norfolk State, approximately 66% of students took out student loans averaging $10,645 a year. That adds up to $42,580 over four years for those students.
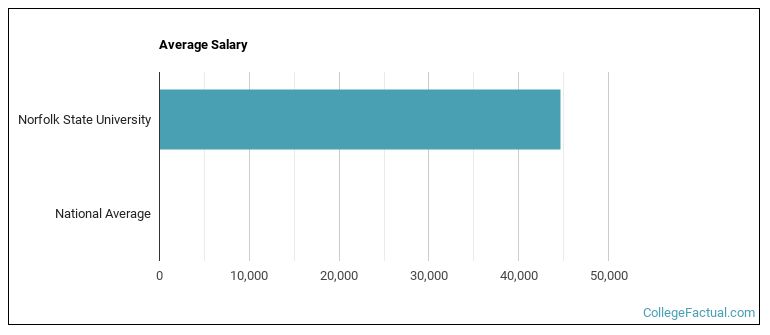
See which majors at Norfolk State University make the most money.
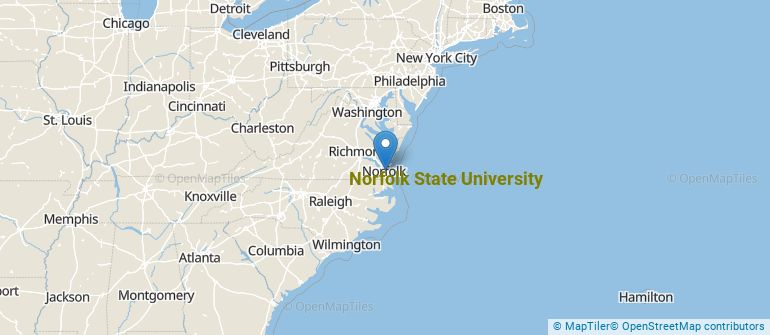
Get more details about the location of Norfolk State University.
Contact details for Norfolk State are given below.
| Contact Details | |
|---|---|
| Address: | 700 Park Avenue, Norfolk, VA 23504-8000 |
| Phone: | 757-823-8600 |
| Website: | www.nsu.edu/ |
| Most Popular Majors | Bachelor’s Degrees | Average Salary of Graduates |
|---|---|---|
| Social Work | 97 | NA |
| General Business/Commerce | 71 | NA |
| General Psychology | 65 | NA |
| Sociology | 61 | NA |
| Other Multi/Interdisciplinary Studies | 56 | NA |
| General Biology | 55 | NA |
| Communication & Journalism (Other) | 54 | NA |
| Health & Medical Administrative Services | 53 | NA |
| Computer Information Systems | 39 | NA |
| Teacher Education Grade Specific | 32 | NA |
Online learning is becoming popular at even the oldest colleges and universities in the United States. Not only are online classes great for returning adults with busy schedules, they are also frequented by a growing number of traditional students.
In 2022-2023, 5,603 students took at least one online class at Norfolk State University. This is an increase from the 5,322 students who took online classes the previous year.
| Year | Took at Least One Online Class | Took All Classes Online |
|---|---|---|
| 2022-2023 | 5,603 | 682 |
| 2021-2022 | 5,322 | 615 |
| 2020-2021 | 4,737 | 338 |
| 2018-2019 | 3,233 | 242 |
Learn more about online learning at Norfolk State University.
If you’re considering Norfolk State University, here are some more schools you may be interested in knowing more about.
Curious on how these schools stack up against Norfolk State? Pit them head to head with College Combat, our free interactive tool that lets you compare college on the features that matter most to you!
Footnotes
*The racial-ethnic minorities count is calculated by taking the total number of students and subtracting white students, international students, and students whose race/ethnicity was unknown. This number is then divided by the total number of students at the school to obtain the racial-ethnic minorities percentage.
References
More about our data sources and methodologies.