Here, you'll find out more about the major, including such details as the number of graduates, what degree levels are offered, ethnicity of students, average salaries, and more. Also, learn how NC State ranks among other schools offering degrees in compsci.
Jump to any of the following sections:
NC State was ranked #45 on College Factual's most recent list of the best schools for compsci majors. This puts the bachelor's program at the school solidly in the top 15% of all colleges and universities in the country. It is also ranked #3 in North Carolina.
During the 2021-2022 academic year, North Carolina State University handed out 281 bachelor's degrees in computer science. This is an increase of 15% over the previous year when 244 degrees were handed out.
In 2022, 253 students received their master’s degree in compsci from NC State. This makes it the #12 most popular school for compsci master’s degree candidates in the country.
In addition, 18 students received their doctoral degrees in compsci in 2022, making the school the #23 most popular school in the United States for this category of students.
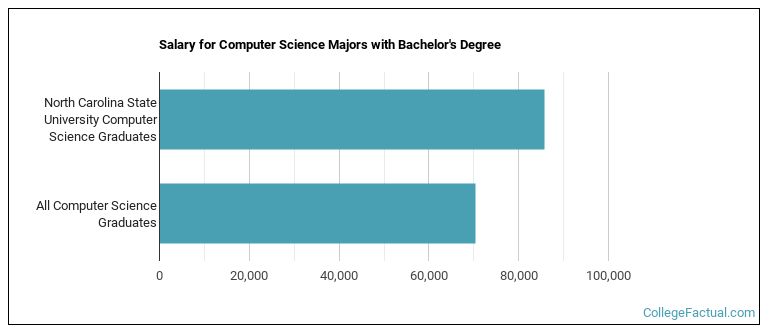
The median salary of compsci students who receive their bachelor's degree at NC State is $85,809. This is higher than $70,400, which is the national median for all compsci bachelor's degree recipients.
The typical student loan payment of a bachelor's degree student from the compsci program at NC State is $313 per month.
During the 2022-2023 academic year, part-time undergraduate students at NC State paid an average of $1,225 per credit hour if they came to the school from out-of-state. In-state students paid a discounted rate of $272 per credit hour. The average full-time tuition and fees for undergraduates are shown in the table below.
| In State | Out of State | |
|---|---|---|
| Tuition | $6,535 | $29,407 |
| Fees | $2,360 | $2,360 |
| Books and Supplies | $869 | $869 |
| On Campus Room and Board | $13,719 | $13,719 |
| On Campus Other Expenses | $3,121 | $3,121 |
Learn more about NC State tuition and fees.
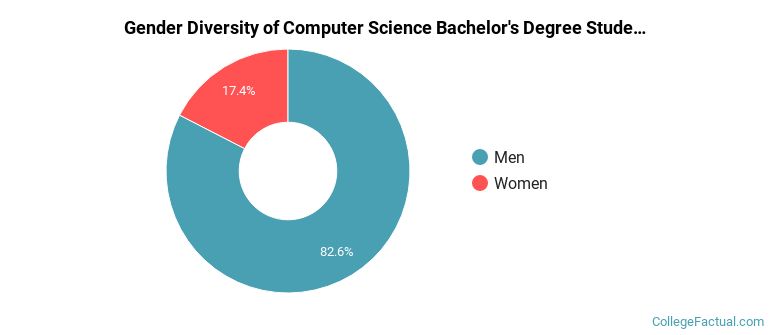
Of the 281 students who earned a bachelor's degree in Computer Science from NC State in 2021-2022, 83% were men and 17% were women.
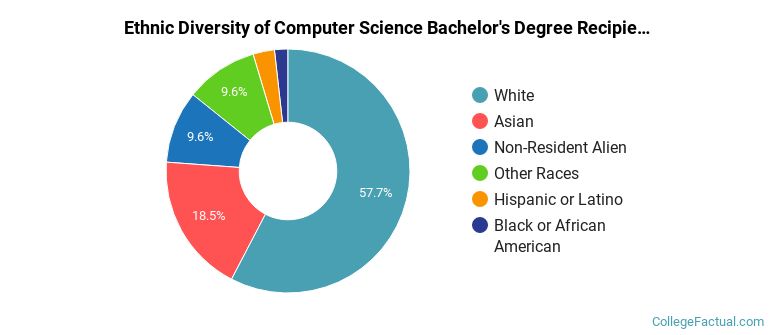
The majority of the students with this major are white. About 58% of 2022 graduates were in this category.
The following table and chart show the ethnic background for students who recently graduated from North Carolina State University with a bachelor's in compsci.
| Ethnic Background | Number of Students |
|---|---|
| Asian | 52 |
| Black or African American | 5 |
| Hispanic or Latino | 8 |
| White | 162 |
| Non-Resident Aliens | 27 |
| Other Races | 27 |
Online degrees for the NC State compsci bachelor’s degree program are not available at this time. To see if the school offers distance learning options in other areas, visit the NC State Online Learning page.
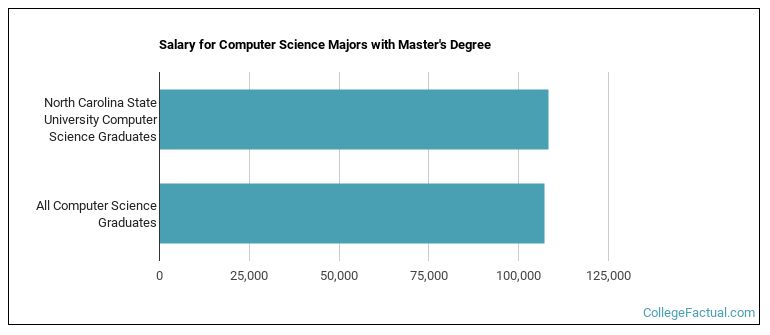
Graduates of the master's compsci program at NC State make a median salary of $108,371. This is a better than average outcome since the median salary for all compsci graduates with a master's is $107,251.
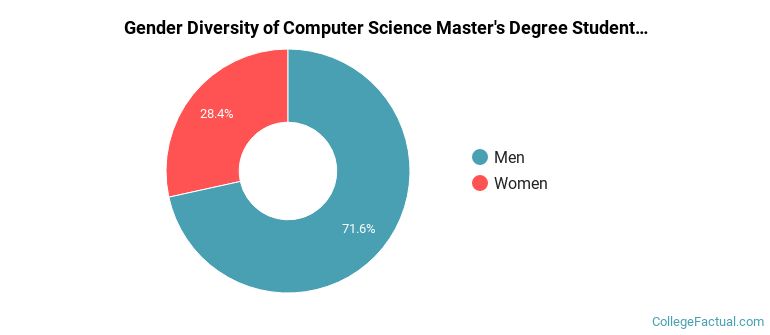
During the 2021-2022 academic year, 109 students graduated with a master's degree in compsci from NC State. About 72% were men and 28% were women.
The following table and chart show the ethnic background for students who recently graduated from North Carolina State University with a master's in compsci.
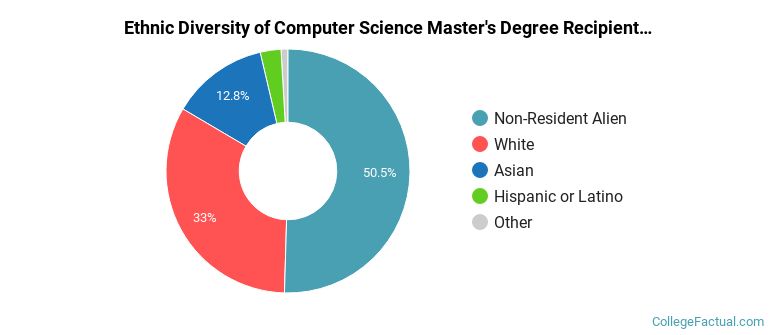
| Ethnic Background | Number of Students |
|---|---|
| Asian | 14 |
| Black or African American | 0 |
| Hispanic or Latino | 3 |
| White | 36 |
| Non-Resident Aliens | 55 |
| Other Races | 1 |
Take a look at the following statistics related to the make-up of the compsci majors at North Carolina State University.
| Related Major | Annual Graduates |
|---|---|
| Computer Software & Applications | 115 |
| Computer Systems Networking | 3 |
More about our data sources and methodologies.