Go directly to any of the following sections:
The education major at NCTC is not ranked on College Factual’s Best Colleges and Universities for Education. This could be for a number of reasons, such as not having enough data on the major or school to make an accurate assessment of its quality.
Out-of-state part-time undergraduates at NCTC paid an average of $300 per credit hour in 2022-2023. The average for in-state students was $195 per credit hour. The following table shows the average full-time tuition and fees for undergraduates.
| In State | Out of State | |
|---|---|---|
| Tuition | $2,760 | $4,944 |
| Fees | $1,920 | $2,256 |
| Books and Supplies | $1,680 | $1,680 |
| On Campus Room and Board | $4,827 | $4,827 |
| On Campus Other Expenses | $3,538 | $3,538 |
Learn more about NCTC tuition and fees.
NCTC does not offer an online option for its education bachelor’s degree program at this time. To see if the school offers distance learning options in other areas, visit the NCTC Online Learning page.
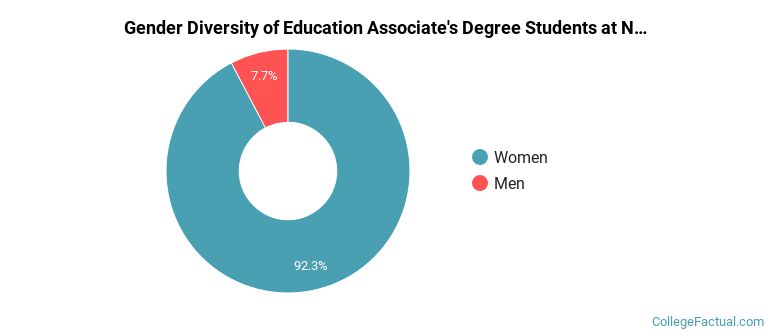
During the 2021-2022 academic year, 39 education majors earned their associate's degree from NCTC. Of these graduates, 8% were men and 92% were women.
The majority of the students with this major are white. About 59% of 2022 graduates were in this category.
The following table and chart show the ethnic background for students who recently graduated from North Central Texas College with a associate's in education.
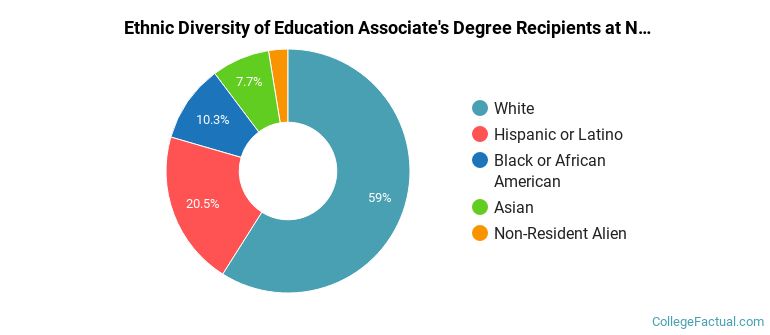
| Ethnic Background | Number of Students |
|---|---|
| Asian | 3 |
| Black or African American | 4 |
| Hispanic or Latino | 8 |
| White | 23 |
| Non-Resident Aliens | 1 |
| Other Races | 0 |
Education students may decide to major in one of the following focus areas. Individual majors may not be available for all degree levels.
| Major | Annual Graduates |
|---|---|
| Teacher Education Grade Specific | 39 |