Here, you'll find out more about the major, including such details as the number of graduates, what degree levels are offered, ethnicity of students, average salaries, and more. In addition, we cover how Northeastern Illinois University ranks in comparison to other schools with political science programs.
Jump to any of the following sections:
Learn about start dates, transferring credits, availability of financial aid, and more by contacting the universities below.
Gain a solid understanding of American political history, the current political landscape, and the major political parties with this online bachelor's from Southern New Hampshire University.
The bachelor's program at Northeastern Illinois University was ranked #523 on College Factual's Best Schools for political science list. It is also ranked #21 in Illinois.
| Ranking Type | Rank |
|---|---|
| Best Political Science & Government Bachelor’s Degree Schools | 510 |
| Best Political Science & Government Schools | 523 |
During the 2021-2022 academic year, Northeastern Illinois University handed out 17 bachelor's degrees in political science & government. Last year, the same number of degrees were handed out.
In 2022, 6 students received their master’s degree in political science from Northeastern Illinois University. This makes it the #92 most popular school for political science master’s degree candidates in the country.
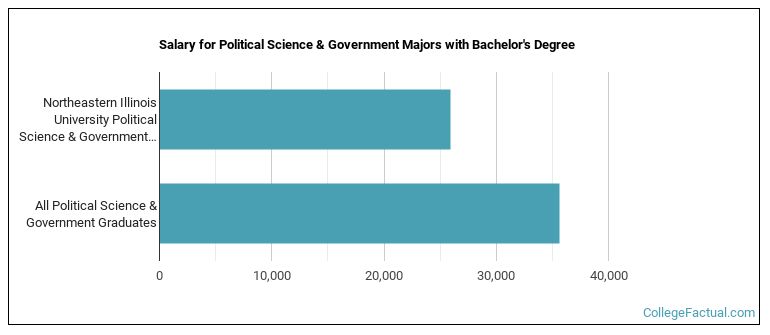
Political Science majors who earn their bachelor's degree from Northeastern Illinois University go on to jobs where they make a median salary of $25,912 a year. Unfortunately, this is lower than the national average of $35,631 for all political science students.
Out-of-state part-time undergraduates at Northeastern Illinois University paid an average of $862 per credit hour in 2022-2023. The average for in-state students was $431 per credit hour. The following table shows the average full-time tuition and fees for undergraduates.
| In State | Out of State | |
|---|---|---|
| Tuition | $10,343 | $20,686 |
| Fees | $2,040 | $2,040 |
| Books and Supplies | $2,400 | $2,400 |
| On Campus Room and Board | $10,742 | $10,742 |
| On Campus Other Expenses | $7,218 | $7,218 |
Learn more about Northeastern Illinois University tuition and fees.
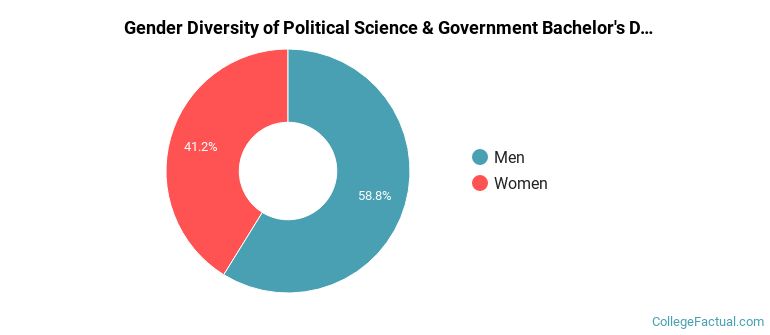
During the 2021-2022 academic year, 17 political science majors earned their bachelor's degree from Northeastern Illinois University. Of these graduates, 59% were men and 41% were women.
The following table and chart show the ethnic background for students who recently graduated from Northeastern Illinois University with a bachelor's in political science.
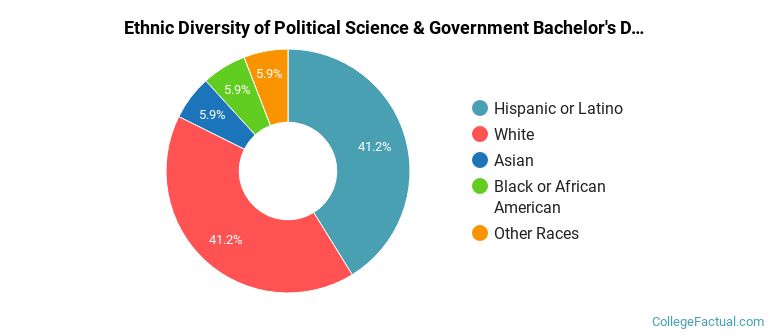
| Ethnic Background | Number of Students |
|---|---|
| Asian | 1 |
| Black or African American | 1 |
| Hispanic or Latino | 7 |
| White | 7 |
| Non-Resident Aliens | 0 |
| Other Races | 1 |
Northeastern Illinois University does not offer an online option for its political science bachelor’s degree program at this time. To see if the school offers distance learning options in other areas, visit the Northeastern Illinois University Online Learning page.
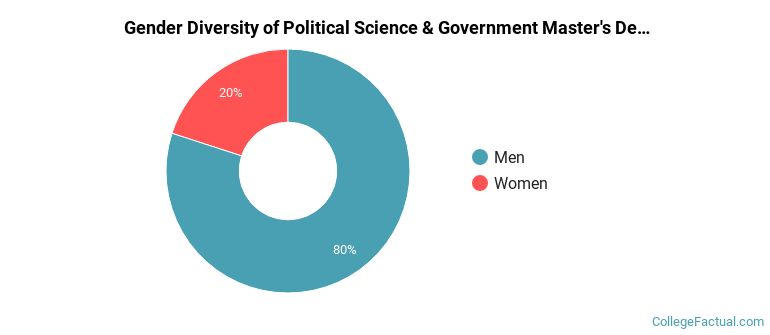
During the 2021-2022 academic year, 5 political science majors earned their master's degree from Northeastern Illinois University. Of these graduates, 80% were men and 20% were women.
The following table and chart show the ethnic background for students who recently graduated from Northeastern Illinois University with a master's in political science.
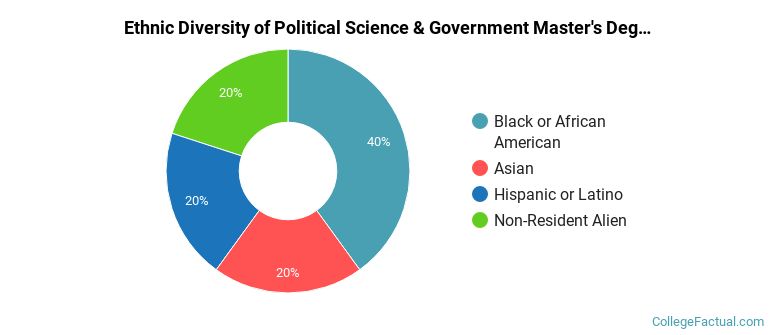
| Ethnic Background | Number of Students |
|---|---|
| Asian | 1 |
| Black or African American | 2 |
| Hispanic or Latino | 1 |
| White | 0 |
| Non-Resident Aliens | 1 |
| Other Races | 0 |
Take a look at the following statistics related to the make-up of the political science majors at Northeastern Illinois University.
| Related Major | Annual Graduates |
|---|---|
| Sociology | 18 |
| Economics | 17 |
| Anthropology | 8 |
| Other Social Sciences | 8 |
| Geography & Cartography | 5 |
More about our data sources and methodologies.
