We've pulled together some essential information you should know about the program, including how many students graduate each year, the ethnic diversity of these students, and more. We've also included details on how Northern Virginia Community College ranks compared to other colleges offering a major in visual arts.
Go directly to any of the following sections:
The bachelor's program at Northern Virginia Community College was ranked #47 on College Factual's Best Schools for visual arts list.
During the 2022-2023 academic year, part-time undergraduate students at Northern Virginia Community College paid an average of $364 per credit hour if they came to the school from out-of-state. In-state students paid a discounted rate of $185 per credit hour. The following table shows the average full-time tuition and fees for undergraduates.
| In State | Out of State | |
|---|---|---|
| Tuition | $5,550 | $10,928 |
| Fees | $153 | $858 |
| Books and Supplies | $1,800 | $1,800 |
Learn more about Northern Virginia Community College tuition and fees.
Online degrees for the Northern Virginia Community College visual arts bachelor’s degree program are not available at this time. To see if the school offers distance learning options in other areas, visit the Northern Virginia Community College Online Learning page.
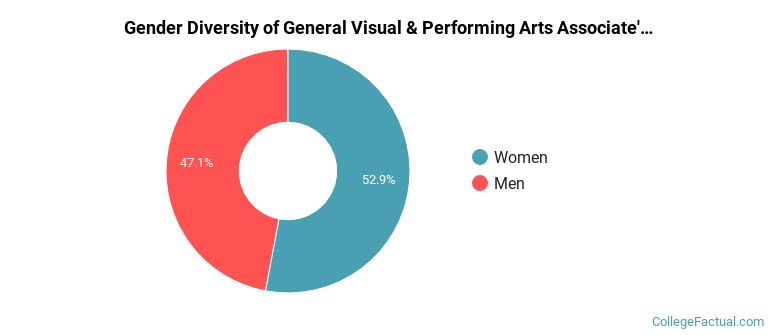
Of the 17 visual arts students who graduated with a associate's degree in 2021-2022 from Northern Virginia Community College, about 47% were men and 53% were women.
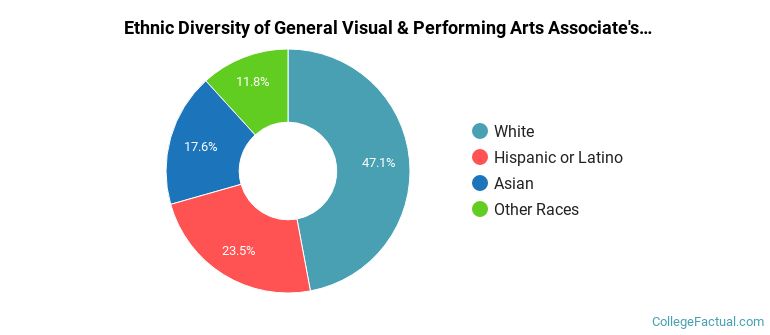
The following table and chart show the ethnic background for students who recently graduated from Northern Virginia Community College with a associate's in visual arts.
| Ethnic Background | Number of Students |
|---|---|
| Asian | 3 |
| Black or African American | 0 |
| Hispanic or Latino | 4 |
| White | 8 |
| Non-Resident Aliens | 0 |
| Other Races | 2 |
| Related Major | Annual Graduates |
|---|---|
| Fine & Studio Arts | 88 |
| Design & Applied Arts | 75 |
| Film, Video & Photographic Arts | 50 |