Here is an overview of this program at NSU. Degrees are awarded at the Bachelor’s, Certificate levels, with graduate study also available. At its best it places at #4 out of 5 schools (Bachelor’s level) by College Factual. Jump to any of the following sections:
College Factual ranks NSU as a strong choice for allied health professions, placing at #795 out of 1,080 schools nationally.
| Ranking | Rank |
|---|---|
| Best Allied Health Professions Schools | 795 of 1,080 |
| Best Allied Health Professions Schools in Louisiana | 12 of 18 |
| Best Allied Health Professions Schools in the Southeast Region | 209 of 311 |
Here is each degree level granted in allied health professions at NSU, along with how many graduates complete each level annually.
| Degree Level | Annual Graduates |
|---|---|
| Bachelor’s | 81 |
| Certificate | 8 |
| Master’s | 14 |
During the most recent reporting year, Northwestern State University of Louisiana handed out 81 bachelor’s degrees in allied health professions.
NSU ranks competitively among schools offering allied health professions at the bachelor’s level. Specifically, it ranked #4 out of 5 schools by College Factual.
Allied Health Professions graduates with a bachelor’s degree from NSU earn a median of $54,284 a year. This is below $54,388, the median for all majors at NSU.
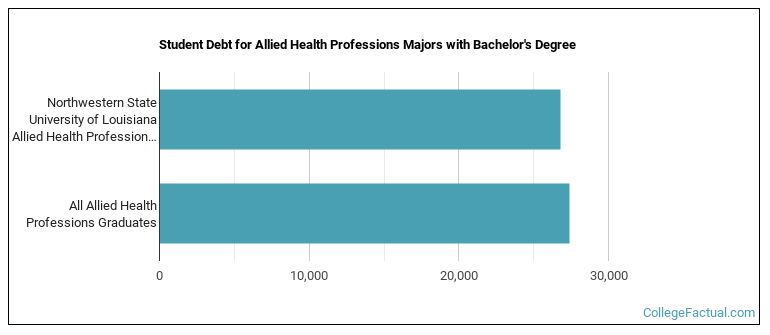
Earning a bachelor’s degree at NSU, allied health professions graduates take on a median debt of $26,797 in student loans. This is lower than $27,418, the typical median for all majors at NSU.
Information about average full-time undergraduate tuition and fees is shown in the table below.
| In State | Out of State | |
|---|---|---|
| Tuition | $5,180 | $15,968 |
| Fees | $3,684 | $3,684 |
Read more about NSU tuition and fees.
In the most recent graduating class, 16% of allied health professions bachelor’s degrees went to men and 84% went to women.
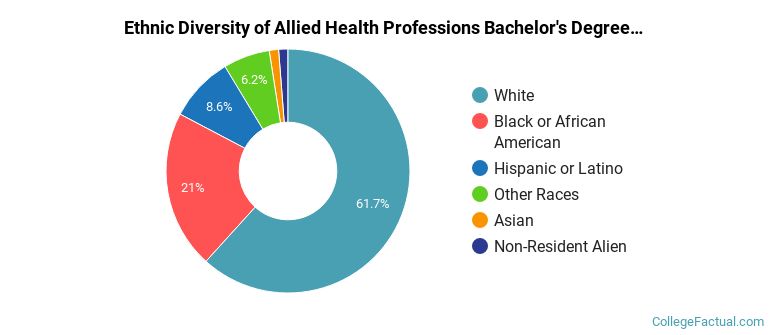
 The largest share of allied health professions bachelor’s degree graduates at NSU were White. Approximately 62% of graduates fell into this category.
The following table and chart show the ethnic background for students who recently graduated from Northwestern State University of Louisiana with a bachelor’s in allied health professions.
| Ethnic Background | Number of Students |
|---|---|
| Asian | 1 |
| Black or African American | 17 |
| Hispanic or Latino | 7 |
| White | 50 |
| Non-Resident Aliens | 1 |
| Other Races | 5 |
NSU awarded 81 bachelor’s degrees in radiologic technology/science - radiographer in the latest year of data — 84% to women and 16% to men. The most common background among these graduates was White (62%).
During the most recent reporting year, Northwestern State University of Louisiana conferred 8 certificate degrees in allied health professions.
NSU has not been ranked for allied health professions at the certificate level.
Every one of the 8 students who graduated with a certificate degree in allied health professions from NSU were women.
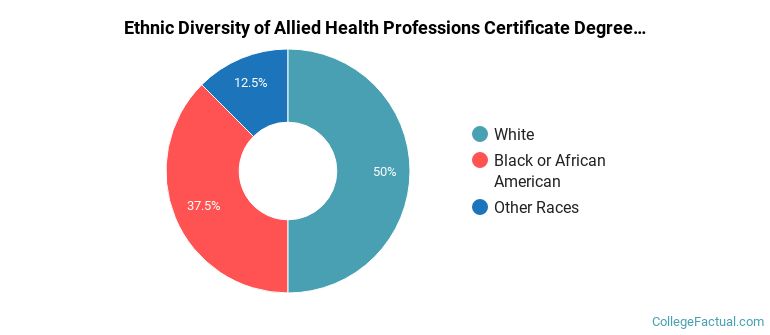
 The largest share of allied health professions certificate degree graduates at NSU were White. About 50% of graduates fell into this category.
The following table and chart show the ethnic background for students who recently graduated from Northwestern State University of Louisiana with a certificate in allied health professions.
| Ethnic Background | Number of Students |
|---|---|
| Asian | 0 |
| Black or African American | 3 |
| Hispanic or Latino | 0 |
| White | 4 |
| Non-Resident Aliens | 0 |
| Other Races | 1 |
NSU conferred 4 certificate degrees in magnetic resonance imaging (mri) technology/technician in the latest year of data — 100% to women and 0% to men. The most common background among these graduates was Black or African American (75%).
NSU granted 3 certificate degrees in cardiovascular technology/technologist in the latest year of data — 100% to women and 0% to men. Most of these graduates identified as White (67%).
NSU awarded 1 certificate completion in radiologic technology/science - radiographer recently — 100% to women and 0% to men. The largest share of these graduates were White (100%).
This program is also offered at the graduate level at NSU. Here are the graduate award levels offered.
| Graduate Level | Annual Graduates |
|---|---|
| Master’s Degrees in Allied Health Professions | 14 |
