In its yearly rankings, College Factual analyzes over 2,000 colleges and universities to determine which ones are the best in a variety of categories, such as overall value, quality, diversity, which schools are the best for each major, and much more.
Northwood University was awarded 13 badges in the 2025 rankings. The highest ranked major at the school is business, management & marketing.
Explore the best ranked schools for the programs you are most interested in.
Northwood was not ranked in College Factual's 2025 Best Overall Colleges report. This could be for a number of reasons, including lack of data.
Northwood University has an acceptance rate of 80%, which makes it somewhat selective. Make sure it's not the only school you apply to, even if it's your school of choice. Whether you get in or not will largely depend on how you compare to other applicants.
About 65% of students accepted to Northwood submitted their SAT scores. When looking at the 25th through the 75th percentile, SAT Evidence-Based Reading and Writing scores ranged between 470 and 580. Math scores were between 480 and 580.
The student to faculty ratio is often used to measure the number of teaching resources that a college or university offers its students. The national average for this metric is 15 to 1, but at Northwood it is much better at 8 to 1. That's good news for students who want to interact more on a personal level with their teachers.
When estimating how much access students will have to their teachers, some people like to look at what percentage of faculty members are full time. This is because part-time teachers may not have as much time to spend on campus as their full-time counterparts.
The full-time faculty percentage at Northwood University is 11%. This is lower than the national average of 47%.
The freshmen retention rate of 81% tells us that most first-year, full-time students like Northwood University enough to come back for another year. This is a fair bit higher than the national average of 68%. That's certainly something to check off in the good column about the school.
Students are considered to have graduated on time if they finish their studies within four years. At Northwood the on-time graduation rate of first-time, full-time students is 43%. That is great when compared to the national average of 33.3%
Find out more about the retention and graduation rates at Northwood University.
During the 2017-2018 academic year, there were 2,254 undergraduates at Northwood with 1,358 being full-time and 896 being part-time.
| $0-30 K | $30K-48K | $48-75 | $75-110K | $110K + |
|---|---|---|---|---|
| $17,081 | $15,546 | $21,584 | $25,219 | $27,290 |
The net price is calculated by adding tuition, room, board and other costs and subtracting financial aid.Note that the net price is typically less than the published for a school. For more information on the sticker price of Northwood, see our tuition and fees and room and board pages.
While almost two-thirds of students nationwide take out loans to pay for college, the percentage may be quite different for the school you plan on attending. At Northwood, approximately 84% of students took out student loans averaging $7,652 a year. That adds up to $30,608 over four years for those students.
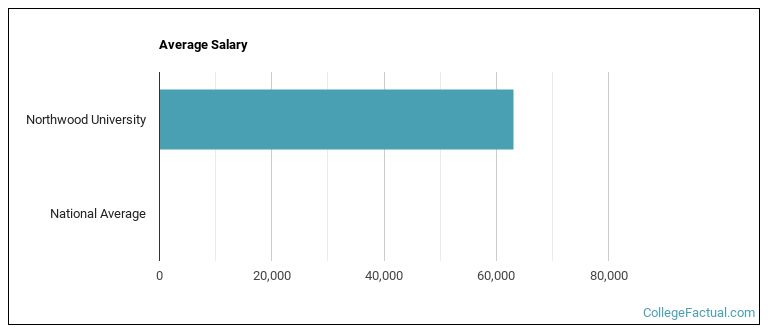
See which majors at Northwood University make the most money.
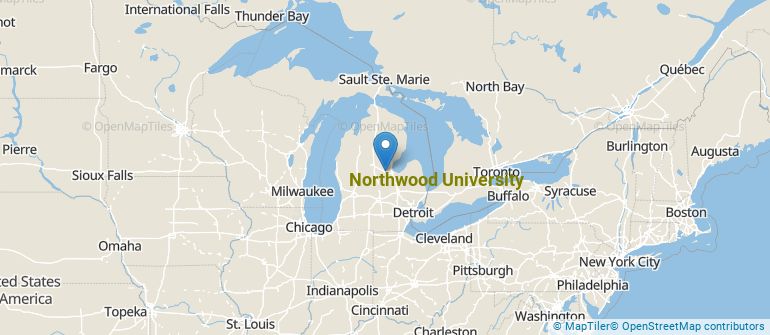
Get more details about the location of Northwood University.
Contact details for Northwood are given below.
| Contact Details | |
|---|---|
| Address: | 4000 Whiting Dr, Midland, MI 48640-2398 |
| Phone: | 800-622-9000 |
| Website: | www.northwood.edu/ |
| Most Popular Majors | Bachelor’s Degrees | Average Salary of Graduates |
|---|---|---|
| Business Administration & Management | 490 | $51,943 |
| Accounting | 96 | $45,217 |
| Marketing | 55 | $40,297 |
| Finance & Financial Management | 52 | $56,940 |
| Specialized Sales, Merchandising & Marketing | 39 | $64,100 |
| Health & Medical Administrative Services | 19 | NA |
| Health & Physical Education | 18 | $28,569 |
| Management Sciences & Quantitative Methods | 17 | $54,298 |
| Entrepreneurial Studies | 12 | NA |
| Radio, Television & Digital Communication | 11 | NA |
Online courses area a great option for busy, working students as well as for those who have scheduling conflicts and want to study on their own time. As time goes by, expect to see more and more online learning options become available.
In 2022-2023, 1,567 students took at least one online class at Northwood University. This is a decrease from the 1,717 students who took online classes the previous year.
| Year | Took at Least One Online Class | Took All Classes Online |
|---|---|---|
| 2022-2023 | 1,567 | 961 |
| 2021-2022 | 1,717 | 1,078 |
| 2020-2021 | 1,776 | 1,139 |
| 2018-2019 | 2,117 | 1,208 |
Footnotes
*The racial-ethnic minorities count is calculated by taking the total number of students and subtracting white students, international students, and students whose race/ethnicity was unknown. This number is then divided by the total number of students at the school to obtain the racial-ethnic minorities percentage.
References
More about our data sources and methodologies.