Jump to any of the following sections:
The bachelor's program at Oberlin was ranked #127 on College Factual's Best Schools for visual & performing arts list. It is also ranked #4 in Ohio.
| Ranking Type | Rank |
|---|---|
| Best Visual & Performing Arts Bachelor’s Degree Schools | 122 |
| Best Visual & Performing Arts Schools | 127 |
During the 2021-2022 academic year, Oberlin College handed out 215 bachelor's degrees in visual & performing arts. This is an increase of 29% over the previous year when 167 degrees were handed out.
In 2022, 1 students received their master’s degree in visual & performing arts from Oberlin. This makes it the #436 most popular school for visual & performing arts master’s degree candidates in the country.
In 2022-2023, the average part-time undergraduate tuition at Oberlin was $2,656 per credit hour for both in-state and out-of-state students. The following table shows the average full-time tuition and fees for undergraduates.
| In State | Out of State | |
|---|---|---|
| Tuition | $63,700 | $63,700 |
| Fees | $946 | $946 |
| Books and Supplies | $1,908 | $1,908 |
| On Campus Room and Board | $18,942 | $18,942 |
| On Campus Other Expenses | $1,908 | $1,908 |
Learn more about Oberlin tuition and fees.
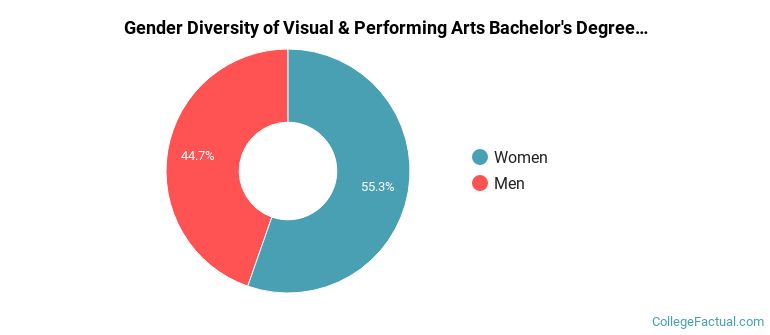
In the 2021-2022 academic year, 215 students earned a bachelor's degree in visual & performing arts from Oberlin. About 55% of these graduates were women and the other 45% were men.
The majority of the students with this major are white. About 59% of 2022 graduates were in this category.
The following table and chart show the ethnic background for students who recently graduated from Oberlin College with a bachelor's in visual & performing arts.
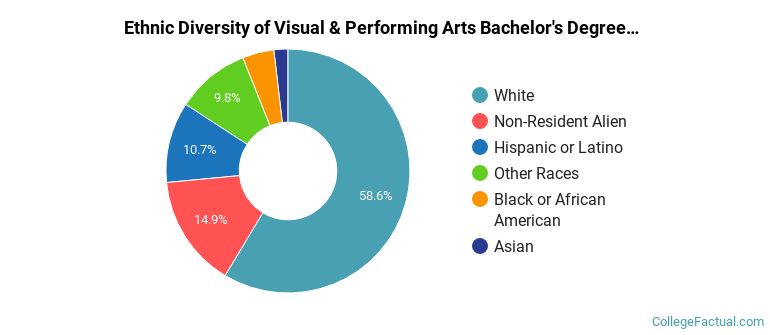
| Ethnic Background | Number of Students |
|---|---|
| Asian | 4 |
| Black or African American | 9 |
| Hispanic or Latino | 23 |
| White | 126 |
| Non-Resident Aliens | 32 |
| Other Races | 21 |
Oberlin does not offer an online option for its visual & performing arts bachelor’s degree program at this time. To see if the school offers distance learning options in other areas, visit the Oberlin Online Learning page.
Take a look at the following statistics related to the make-up of the visual & performing arts majors at Oberlin College.
Visual & Performing Arts students may decide to major in one of the following focus areas. Individual majors may not be available for all degree levels.
| Major | Annual Graduates |
|---|---|
| Music | 140 |
| Fine & Studio Arts | 35 |
| Film, Video & Photographic Arts | 21 |
| Drama & Theater Arts | 15 |
| Dance | 3 |
| Other Visual Art | 1 |
More about our data sources and methodologies.