In its yearly rankings, College Factual analyzes over 2,000 colleges and universities to determine which ones are the best in a variety of categories, such as overall value, quality, diversity, which schools are the best for each major, and much more.
Oglala Lakota College was awarded 1 badge in the 2025 rankings. The highest ranked major at the school is nursing.
Explore the best ranked schools for the programs you are most interested in.
Oglala Lakota College was not ranked in College Factual's 2025 Best Overall Colleges report. This could be for a number of reasons, including lack of data.
Returning adults and other non-traditional students may appreciate the fact that Oglala Lakota College has an open admissions policy. This means that you'll only have to submit basic materials, which may include proof that you completed high school or an equivalent program.
At Oglala Lakota College, the student to faculty ratio is an excellent 10 to 1. That's much better than the national average of 15 to 1. This indicates that many classes will probably be small, and students will have ample opportunites to work closely with their professors and classmates.
When estimating how much access students will have to their teachers, some people like to look at what percentage of faculty members are full time. This is because part-time teachers may not have as much time to spend on campus as their full-time counterparts.
The full-time faculty percentage at Oglala Lakota College is 59%. This is higher than the national average of 47%.
The freshmen retention rate tells us what percentage of first-year, full-time students choose to continue on to their sophomore year at a particular school. The rate at Oglala Lakota College is 67%, which is about average when compared to the national rate of 68%.
During the 2017-2018 academic year, there were 1,222 undergraduates at Oglala Lakota College with 637 being full-time and 585 being part-time.
The net price is calculated by adding tuition, room, board and other costs and subtracting financial aid.Note that the net price is typically less than the published for a school. For more information on the sticker price of Oglala Lakota College, see our tuition and fees and room and board pages.
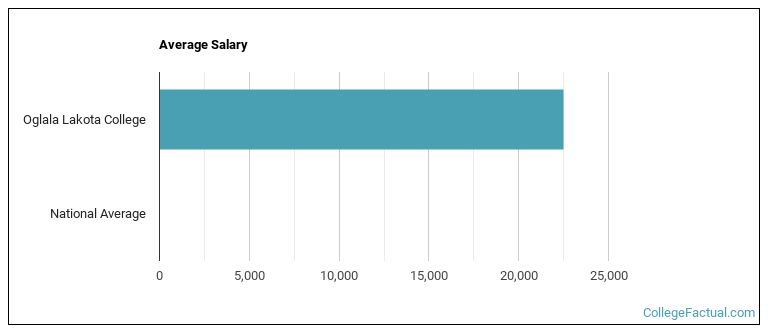
See which majors at Oglala Lakota College make the most money.
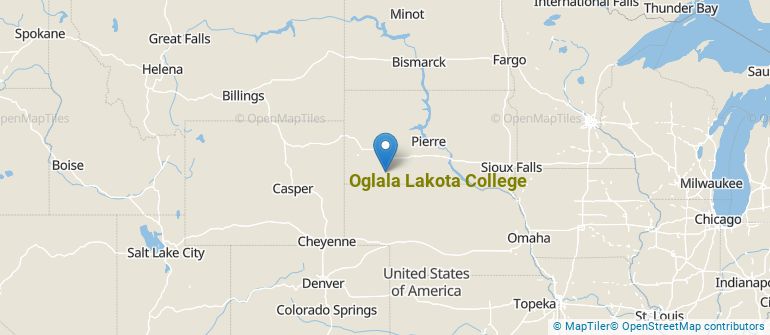
Get more details about the location of Oglala Lakota College.
Contact details for Oglala Lakota College are given below.
| Contact Details | |
|---|---|
| Address: | 490 Piya Wiconi Road, Kyle, SD 57752-0490 |
| Phone: | 605-455-6000 |
| Website: | www.olc.edu/ |
| Most Popular Majors | Bachelor’s Degrees | Average Salary of Graduates |
|---|---|---|
| Business Administration & Management | 35 | NA |
| Ethnic Studies | 28 | NA |
| Teacher Education Grade Specific | 23 | NA |
| Legal Research | 21 | NA |
| Multilingual Education | 16 | NA |
| Nursing | 9 | NA |
| Computer Information Systems | 6 | NA |
| Social Work | 6 | NA |
| Construction | 5 | NA |
| Electrical & Power Transmission Installers | 3 | NA |
Online courses area a great option for busy, working students as well as for those who have scheduling conflicts and want to study on their own time. As time goes by, expect to see more and more online learning options become available.
In 2022-2023, 813 students took at least one online class at Oglala Lakota College. This is a decrease from the 1,451 students who took online classes the previous year.
| Year | Took at Least One Online Class | Took All Classes Online |
|---|---|---|
| 2022-2023 | 813 | 324 |
| 2021-2022 | 1,451 | 1,410 |
| 2020-2021 | 1,251 | 1,251 |
| 2018-2019 | 397 | 0 |
If you’re considering Oglala Lakota College, here are some more schools you may be interested in knowing more about.
Curious on how these schools stack up against Oglala Lakota College? Pit them head to head with College Combat, our free interactive tool that lets you compare college on the features that matter most to you!
Footnotes
*The racial-ethnic minorities count is calculated by taking the total number of students and subtracting white students, international students, and students whose race/ethnicity was unknown. This number is then divided by the total number of students at the school to obtain the racial-ethnic minorities percentage.
References
More about our data sources and methodologies.