We've pulled together some essential information you should know about the program, including how many students graduate each year, the ethnic diversity of these students, average starting salaries, and more. In addition, we cover how Ohio State ranks in comparison to other schools with other agriculture programs.
Go directly to any of the following sections:
The bachelor's program at Ohio State was ranked #1 on College Factual's Best Schools for other agriculture list. It is also ranked #1 in Ohio.
| Ranking Type | Rank |
|---|---|
| Best Other Agriculture Bachelor’s Degree Schools | 1 |
| Best Other Agriculture Schools | 1 |
During the 2021-2022 academic year, Ohio State University - Main Campus handed out 72 bachelor's degrees in other agriculture. This is an increase of 7% over the previous year when 67 degrees were handed out.
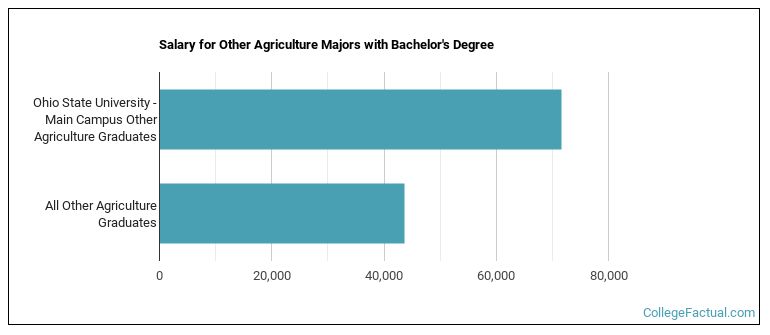
Other Agriculture majors who earn their bachelor's degree from Ohio State go on to jobs where they make a median salary of $71,570 a year. This is higher than $43,602, which is the national median for all other agriculture bachelor's degree recipients.
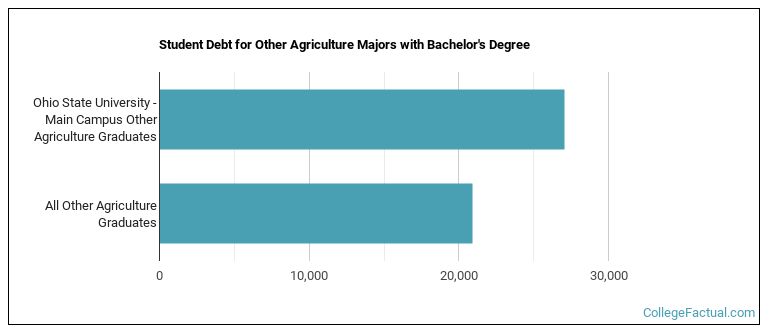
While getting their bachelor's degree at Ohio State, other agriculture students borrow a median amount of $27,083 in student loans. This is higher than the the typical median of $20,920 for all other agriculture majors across the country.
The typical student loan payment of a bachelor's degree student from the other agriculture program at Ohio State is $262 per month.
Out-of-state part-time undergraduates at Ohio State paid an average of $1,556 per credit hour in 2022-2023. The average for in-state students was $493 per credit hour. The following table shows the average full-time tuition and fees for undergraduates.
| In State | Out of State | |
|---|---|---|
| Tuition | $11,826 | $37,332 |
| Fees | $1,033 | $1,033 |
| Books and Supplies | $1,030 | $1,030 |
| On Campus Room and Board | $14,272 | $14,272 |
| On Campus Other Expenses | $3,070 | $3,070 |
Learn more about Ohio State tuition and fees.
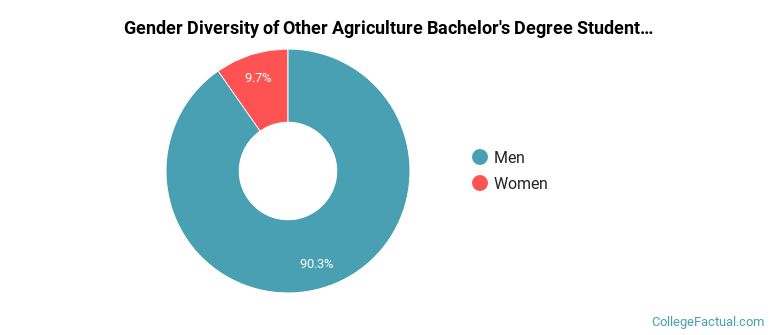
During the 2021-2022 academic year, 72 other agriculture majors earned their bachelor's degree from Ohio State. Of these graduates, 90% were men and 10% were women.
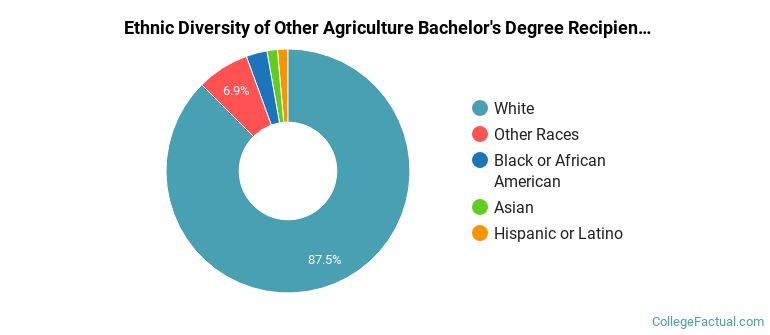
The majority of the students with this major are white. About 88% of 2022 graduates were in this category.
The following table and chart show the ethnic background for students who recently graduated from Ohio State University - Main Campus with a bachelor's in other agriculture.
| Ethnic Background | Number of Students |
|---|---|
| Asian | 1 |
| Black or African American | 2 |
| Hispanic or Latino | 1 |
| White | 63 |
| Non-Resident Aliens | 0 |
| Other Races | 5 |
Ohio State does not offer an online option for its other agriculture bachelor’s degree program at this time. To see if the school offers distance learning options in other areas, visit the Ohio State Online Learning page.
Take a look at the following statistics related to the make-up of the other agriculture majors at Ohio State University - Main Campus.
| Related Major | Annual Graduates |
|---|---|
| Veterinary Medicine | 158 |
| Animal Science | 156 |
| Agricultural Economics & Business | 88 |
| Food Science Technology | 50 |
| Plant Sciences | 44 |
More about our data sources and methodologies.