Here is an overview of this program at Ohio State University-Main Campus. It is offered at the Bachelor’s level, with graduate study also available. It ranks as high as #2 out of 15 schools (Bachelor’s level) by College Factual. Jump to any of the following sections:
By College Factual’s measure, Ohio State University-Main Campus highly for music, ranked #58 out of 416 schools nationally.
| Ranking | Rank |
|---|---|
| Best Music Schools | 58 of 416 |
| Best Music Schools in Ohio | 2 of 15 |
| Best Music Schools in the Great Lakes Region | 7 of 51 |
The table below lists every degree level granted in music at Ohio State University-Main Campus, along with how many graduates complete each level annually.
| Degree Level | Annual Graduates |
|---|---|
| Bachelor’s | 31 |
| Master’s | 15 |
| Doctoral | 11 |
During the most recent reporting year, Ohio State University-Main Campus handed out 31 bachelor’s degrees in music.
Ohio State University-Main Campus is in the top 15% of the country for music at the bachelor’s level. Its best result was #2 out of 15 schools by College Factual.
| Ranking | Rank |
|---|---|
| Best Music Bachelor’s Degree Schools in Ohio | 2 |
| Best Music Bachelor’s Degree Schools in the Great Lakes Region | 8 |
| Best Music Bachelor’s Degree Schools | 70 |
Music graduates with a bachelor’s degree from Ohio State University-Main Campus report a median salary of $40,034 a year. This is lower than $70,261, the median for all majors at Ohio State University-Main Campus.
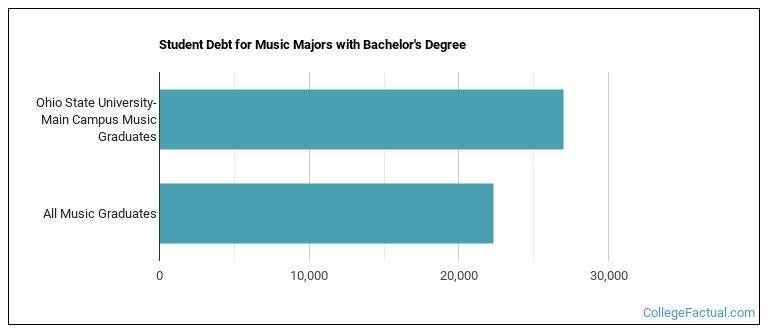
To complete a bachelor’s at Ohio State University-Main Campus, music students accumulate a median of $27,000 in student loans. This is above $22,316, the typical median for all majors at Ohio State University-Main Campus.
Average full-time tuition and fees are listed in the table below.
| In State | Out of State | |
|---|---|---|
| Tuition | $11,018 | $38,958 |
| Fees | $1,064 | $1,064 |
Read more about Ohio State University-Main Campus tuition and fees.
In the most recent graduating class, 65% of music bachelor’s degrees went to men and 35% went to women.
 The largest share of music bachelor’s degree graduates at Ohio State University-Main Campus are White. Approximately 65% of graduates fell into this category.
The following table and chart show the ethnic background for students who recently graduated from Ohio State University-Main Campus with a bachelor’s in music.

| Ethnic Background | Number of Students |
|---|---|
| Asian | 2 |
| Black or African American | 3 |
| Hispanic or Latino | 1 |
| White | 20 |
| Non-Resident Aliens | 3 |
| Other Races | 2 |
Ohio State University-Main Campus granted 7 bachelor’s degrees in music performance, general in the most recent reporting year — 57% to women and 43% to men. The largest share of these graduates were White (71%).
Ohio State University-Main Campus awarded 3 bachelor’s completions in jazz/jazz studies in the latest year of data — 0% to women and 100% to men. Most of these graduates identified as Black or African American (67%).
Graduate study is also available at Ohio State University-Main Campus. Here are the graduate award levels offered.
| Graduate Level | Annual Graduates |
|---|---|
| Master’s Degrees in Music | 15 |
| Doctoral Degrees in Music | 11 |
