We've gathered data and other essential information about the program, such as the average salary of graduates, ethnicity of students, how many students graduated in recent times, and more. In addition, we cover how OHIO Eastern ranks in comparison to other schools with liberal arts programs.
Go directly to any of the following sections:
The liberal arts major at OHIO Eastern is not ranked on College Factual’s Best Colleges and Universities for Liberal Arts General Studies. This could be for a number of reasons, such as not having enough data on the major or school to make an accurate assessment of its quality.
During the 2021-2022 academic year, Ohio University - Eastern Campus handed out 0 bachelor's degrees in liberal arts general studies.
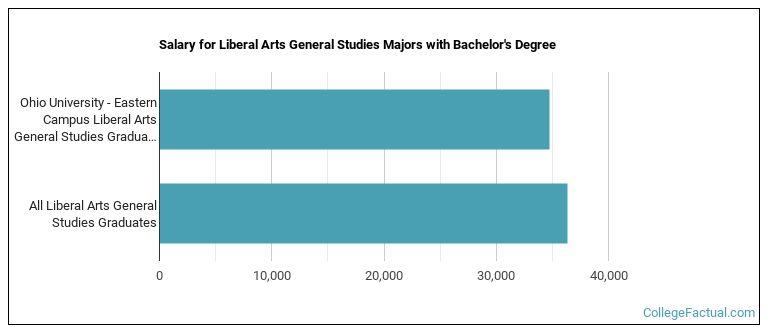
The median salary of liberal arts students who receive their bachelor's degree at OHIO Eastern is $34,707. Unfortunately, this is lower than the national average of $36,340 for all liberal arts students.
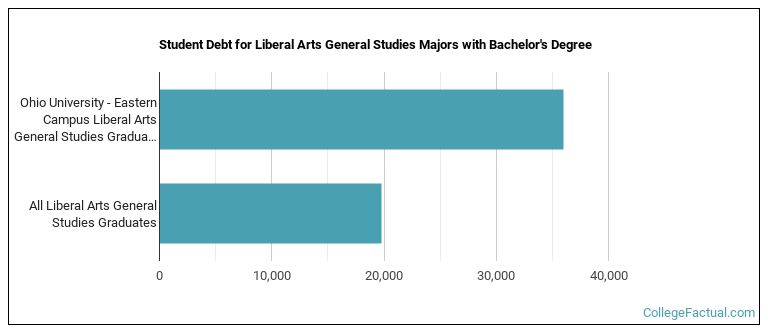
While getting their bachelor's degree at OHIO Eastern, liberal arts students borrow a median amount of $35,998 in student loans. This is higher than the the typical median of $19,782 for all liberal arts majors across the country.
The typical student loan payment of a bachelor's degree student from the liberal arts program at OHIO Eastern is $302 per month.
Learn about other programs related to Liberal Arts General Studies that might interest you.
Maximize your transfer credits and complete your bachelor's degree faster with this flexible online bachelor's from Southern New Hampshire University.
Out-of-state part-time undergraduates at OHIO Eastern paid an average of $412 per credit hour in 2022-2023. The average for in-state students was $276 per credit hour. The average full-time tuition and fees for undergraduates are shown in the table below.
| In State | Out of State | |
|---|---|---|
| Tuition | $6,178 | $9,170 |
| Books and Supplies | $840 | $840 |
Learn more about OHIO Eastern tuition and fees.
OHIO Eastern does not offer an online option for its liberal arts bachelor’s degree program at this time. To see if the school offers distance learning options in other areas, visit the OHIO Eastern Online Learning page.
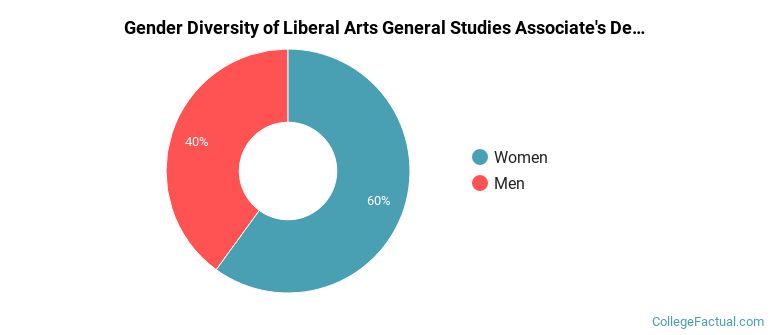
During the 2021-2022 academic year, 10 liberal arts majors earned their associate's degree from OHIO Eastern. Of these graduates, 40% were men and 60% were women.
The majority of associate's degree recipients in this major at OHIO Eastern are white. In the most recent graduating class for which data is available, 80% of students fell into this category.
The following table and chart show the ethnic background for students who recently graduated from Ohio University - Eastern Campus with a associate's in liberal arts.

| Ethnic Background | Number of Students |
|---|---|
| Asian | 0 |
| Black or African American | 1 |
| Hispanic or Latino | 0 |
| White | 8 |
| Non-Resident Aliens | 0 |
| Other Races | 1 |
