We've pulled together some essential information you should know about the program, including how many students graduate each year, the ethnic diversity of these students, and more. In addition, we cover how Pittsburgh Technical College ranks in comparison to other schools with culinary arts programs.
Jump to any of the following sections:
The bachelor's program at Pittsburgh Technical College was ranked #42 on College Factual's Best Schools for culinary arts list.
Part-time undergraduates at Pittsburgh Technical College paid an average of $320 per credit hour in 2022-2023. This tuition was the same for both in-state and out-of-state students. The average full-time tuition and fees for undergraduates are shown in the table below.
| In State | Out of State | |
|---|---|---|
| Tuition | $15,380 | $15,380 |
| Fees | $3,600 | $3,600 |
| Books and Supplies | $2,325 | $2,325 |
| On Campus Room and Board | $12,395 | $12,395 |
| On Campus Other Expenses | $7,108 | $7,108 |
Learn more about Pittsburgh Technical College tuition and fees.
Online degrees for the Pittsburgh Technical College culinary arts bachelor’s degree program are not available at this time. To see if the school offers distance learning options in other areas, visit the Pittsburgh Technical College Online Learning page.
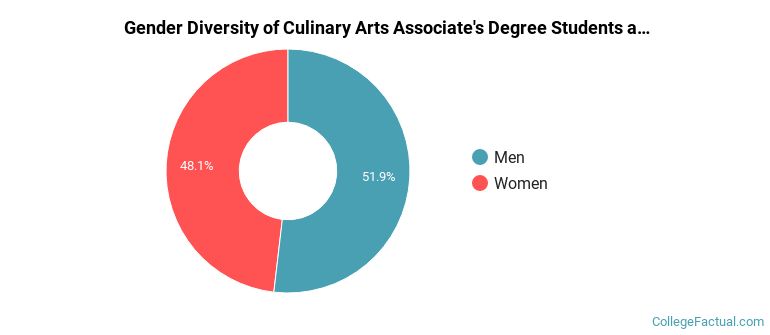
The culinary arts program at Pittsburgh Technical College awarded 27 associate's degrees in 2021-2022. About 52% of these degrees went to men with the other 48% going to women.
The majority of associate's degree recipients in this major at Pittsburgh Technical College are white. In the most recent graduating class for which data is available, 56% of students fell into this category.
The following table and chart show the ethnic background for students who recently graduated from Pittsburgh Technical College with a associate's in culinary arts.
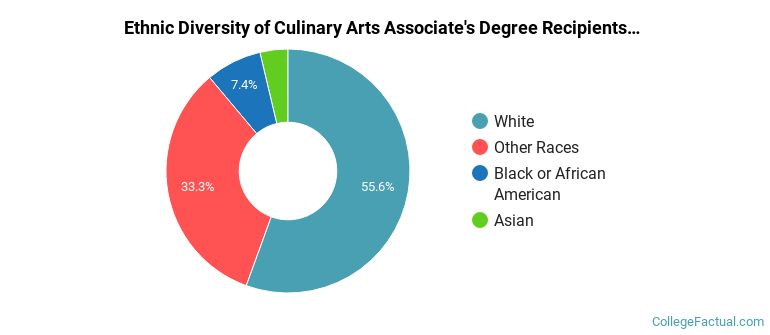
| Ethnic Background | Number of Students |
|---|---|
| Asian | 1 |
| Black or African American | 2 |
| Hispanic or Latino | 0 |
| White | 15 |
| Non-Resident Aliens | 0 |
| Other Races | 9 |