Here, you'll find out more about the major, including such details as the number of graduates, what degree levels are offered, ethnicity of students, average salaries, and more. Also, learn how Pratt Institute ranks among other schools offering degrees in design.
Jump to any of the following sections:
Learn about start dates, transferring credits, availability of financial aid, and more by contacting the universities below.
BA in Graphic Design & Media Arts
Translate your creative ideas through concept, design and digital media with a bachelor's in graphic design online from Southern New Hampshire University.
Take the first step toward a career of visual expression and doing what you love with this online associate degree from Southern New Hampshire University.
Learn to create a striking portfolio and hone the skills you need to succeed in the world of professional photography with this online digital photography degree from Southern New Hampshire University.
In College Factual's most recent rankings for the best schools for design majors, Pratt Institute came in at #7. This puts it in the top 5% of the country in this field of study. It is also ranked #3 in New York.
During the 2021-2022 academic year, Pratt Institute - Main handed out 273 bachelor's degrees in design & applied arts. This is a decrease of 32% over the previous year when 400 degrees were handed out.
In 2022, 180 students received their master’s degree in design from Pratt Institute. This makes it the #2 most popular school for design master’s degree candidates in the country.
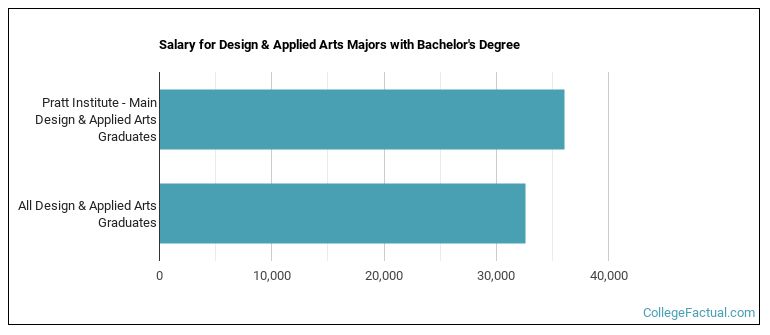
The median salary of design students who receive their bachelor's degree at Pratt Institute is $36,040. This is great news for graduates of the program, since this figure is higher than the national average of $32,606 for all design bachelor's degree recipients.
While getting their bachelor's degree at Pratt Institute, design students borrow a median amount of $94,619 in student loans. This is higher than the the typical median of $36,178 for all design majors across the country.
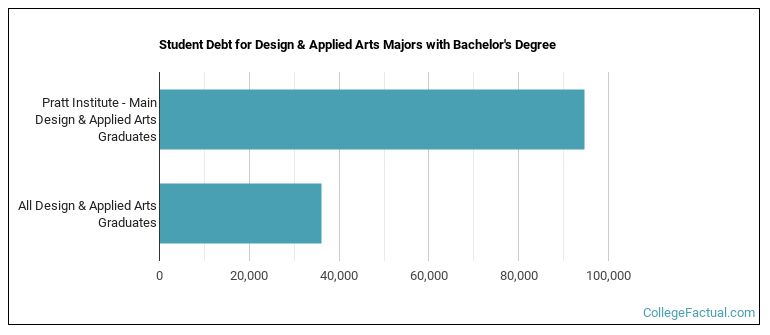
The typical student loan payment of a bachelor's degree student from the design program at Pratt Institute is $1,175 per month.
Learn about other programs related to Design & Applied Arts that might interest you.
Get on the right path to the fast-paced, exciting world of video game art and design with this online bachelor's from Southern New Hampshire University.
BA in Graphic Design & Media Arts - Web Design
Gain a solid grounding in your online web design classes and exercise your creative muscle with this specialized online bachelor's from Southern New Hampshire University.
During the 2022-2023 academic year, part-time undergraduate students at Pratt Institute paid an average of $1,860 per credit hour. No discount was available for in-state students. The following table shows the average full-time tuition and fees for undergraduates.
| In State | Out of State | |
|---|---|---|
| Tuition | $57,659 | $57,659 |
| Fees | $2,024 | $2,024 |
| Books and Supplies | $2,100 | $2,100 |
| On Campus Room and Board | $16,710 | $16,710 |
| On Campus Other Expenses | $2,500 | $2,500 |
Learn more about Pratt Institute tuition and fees.
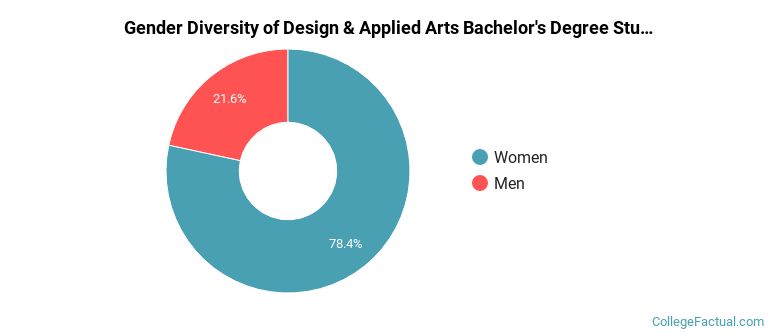
Of the 273 design students who graduated with a bachelor's degree in 2021-2022 from Pratt Institute, about 22% were men and 78% were women.
The following table and chart show the ethnic background for students who recently graduated from Pratt Institute - Main with a bachelor's in design.
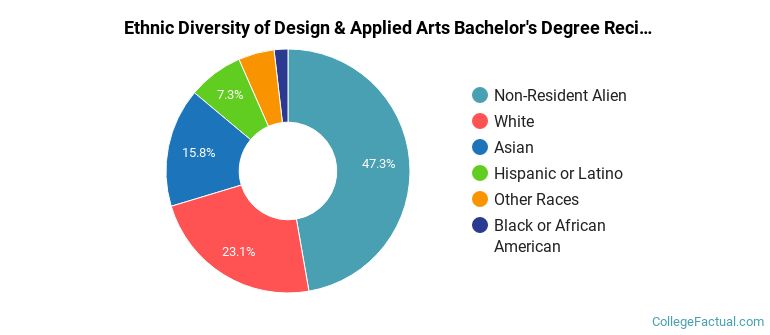
| Ethnic Background | Number of Students |
|---|---|
| Asian | 43 |
| Black or African American | 5 |
| Hispanic or Latino | 20 |
| White | 63 |
| Non-Resident Aliens | 129 |
| Other Races | 13 |
Online degrees for the Pratt Institute design bachelor’s degree program are not available at this time. To see if the school offers distance learning options in other areas, visit the Pratt Institute Online Learning page.
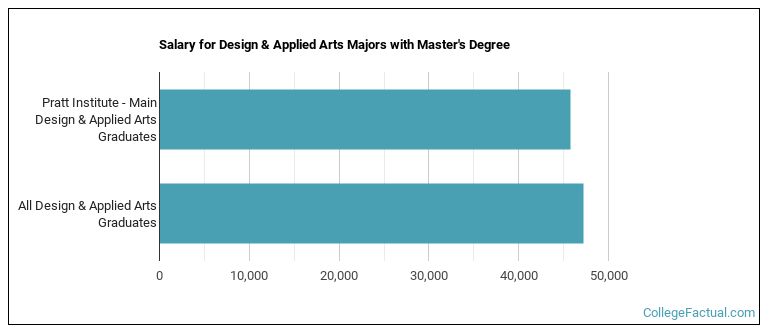
Graduates of the master's design program at Pratt Institute make a median salary of $45,720. This is less than what their typical peers from other schools make. Their median salary is $47,217.
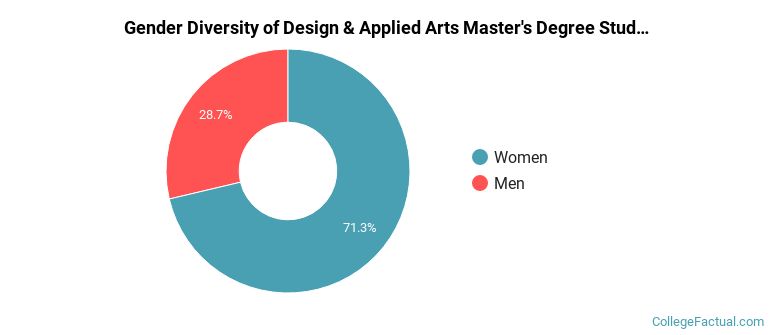
During the 2021-2022 academic year, 122 students graduated with a master's degree in design from Pratt Institute. About 29% were men and 71% were women.
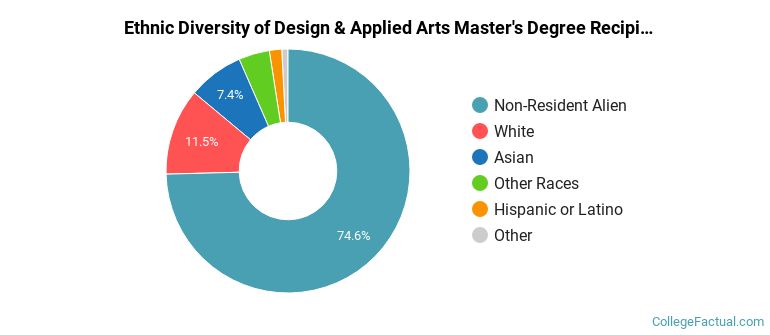
The following table and chart show the ethnic background for students who recently graduated from Pratt Institute - Main with a master's in design.
| Ethnic Background | Number of Students |
|---|---|
| Asian | 9 |
| Black or African American | 1 |
| Hispanic or Latino | 2 |
| White | 14 |
| Non-Resident Aliens | 91 |
| Other Races | 5 |
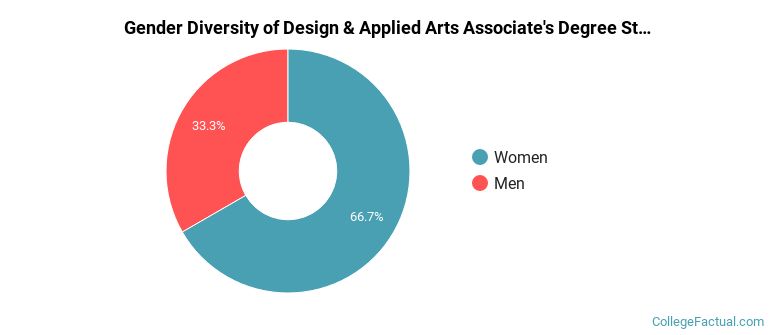
Of the 18 design students who graduated with a associate's degree in 2021-2022 from Pratt Institute, about 33% were men and 67% were women.
The following table and chart show the ethnic background for students who recently graduated from Pratt Institute - Main with a associate's in design.
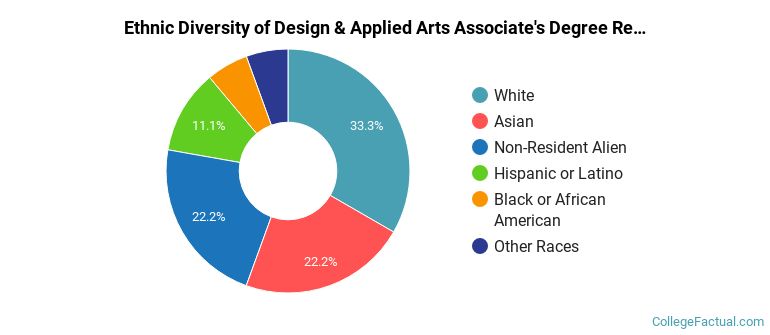
| Ethnic Background | Number of Students |
|---|---|
| Asian | 4 |
| Black or African American | 1 |
| Hispanic or Latino | 2 |
| White | 6 |
| Non-Resident Aliens | 4 |
| Other Races | 1 |
Take a look at the following statistics related to the make-up of the design majors at Pratt Institute - Main.
| Related Major | Annual Graduates |
|---|---|
| Fine & Studio Arts | 123 |
| Film, Video & Photographic Arts | 64 |
| Arts & Media Management | 43 |
More about our data sources and methodologies.
