We've gathered data and other essential information about the program, such as the average salary of graduates, ethnicity of students, how many students graduated in recent times, and more. In addition, we cover how Princeton ranks in comparison to other schools with neurobiology programs.
Go directly to any of the following sections:
The neurobiology major at Princeton is not ranked on College Factual’s Best Colleges and Universities for Neurobiology & Neurosciences. This could be for a number of reasons, such as not having enough data on the major or school to make an accurate assessment of its quality.
During the 2021-2022 academic year, Princeton University handed out 37 bachelor's degrees in neurobiology & neurosciences. This is an increase of 3% over the previous year when 36 degrees were handed out.
In 2022, 7 students received their master’s degree in neurobiology from Princeton. This makes it the #20 most popular school for neurobiology master’s degree candidates in the country.
In addition, 5 students received their doctoral degrees in neurobiology in 2022, making the school the #60 most popular school in the United States for this category of students.
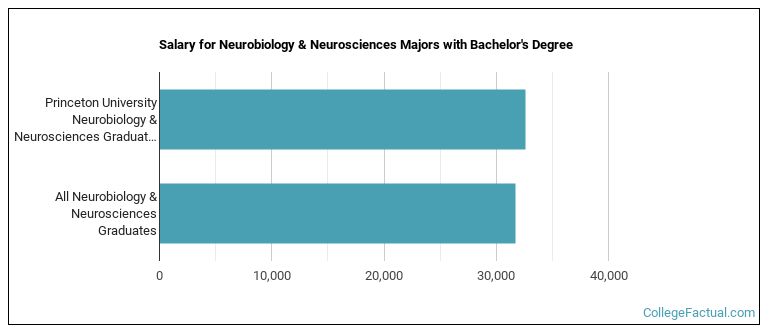
Neurobiology majors who earn their bachelor's degree from Princeton go on to jobs where they make a median salary of $32,647 a year. This is great news for graduates of the program, since this figure is higher than the national average of $31,687 for all neurobiology bachelor's degree recipients.
In 2022-2023, the average part-time undergraduate tuition at Princeton was $1,926 per credit hour for both in-state and out-of-state students. Information about average full-time undergraduate tuition and fees is shown in the table below.
| In State | Out of State | |
|---|---|---|
| Tuition | $59,710 | $59,710 |
| Books and Supplies | $1,050 | $1,050 |
| On Campus Room and Board | $19,380 | $19,380 |
| On Campus Other Expenses | $3,900 | $3,900 |
Learn more about Princeton tuition and fees.
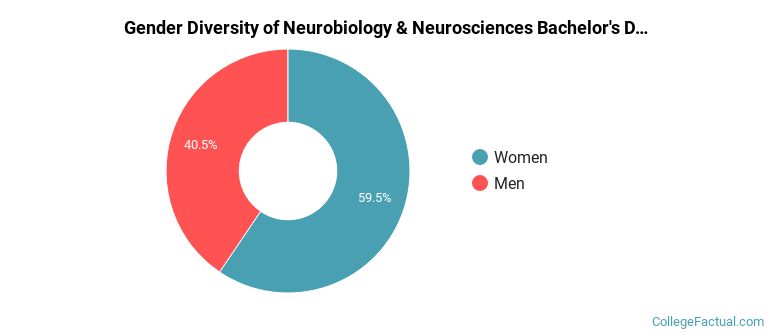
During the 2021-2022 academic year, 37 students graduated with a bachelor's degree in neurobiology from Princeton. About 41% were men and 59% were women.
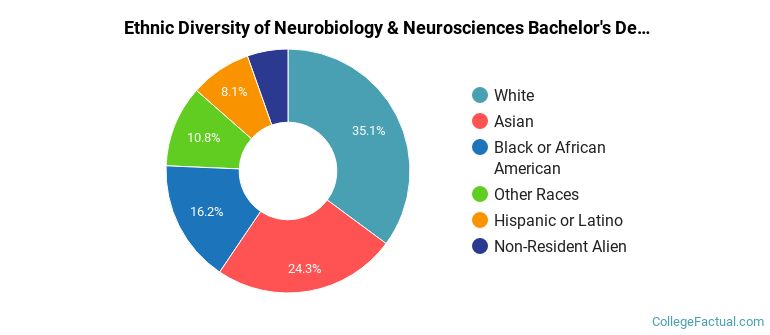
The following table and chart show the ethnic background for students who recently graduated from Princeton University with a bachelor's in neurobiology.
| Ethnic Background | Number of Students |
|---|---|
| Asian | 9 |
| Black or African American | 6 |
| Hispanic or Latino | 3 |
| White | 13 |
| Non-Resident Aliens | 2 |
| Other Races | 4 |
Online degrees for the Princeton neurobiology bachelor’s degree program are not available at this time. To see if the school offers distance learning options in other areas, visit the Princeton Online Learning page.
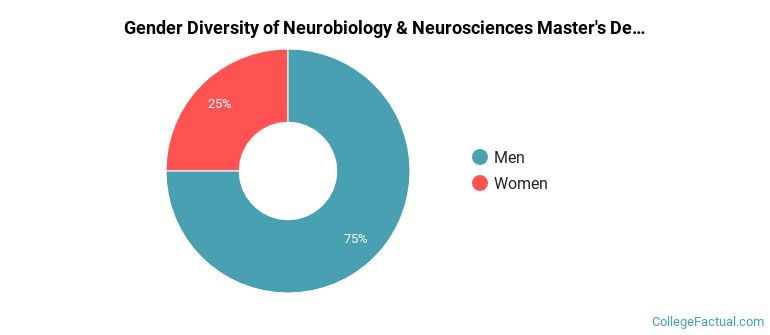
In the 2021-2022 academic year, 12 students earned a master's degree in neurobiology from Princeton. About 25% of these graduates were women and the other 75% were men.
The following table and chart show the ethnic background for students who recently graduated from Princeton University with a master's in neurobiology.
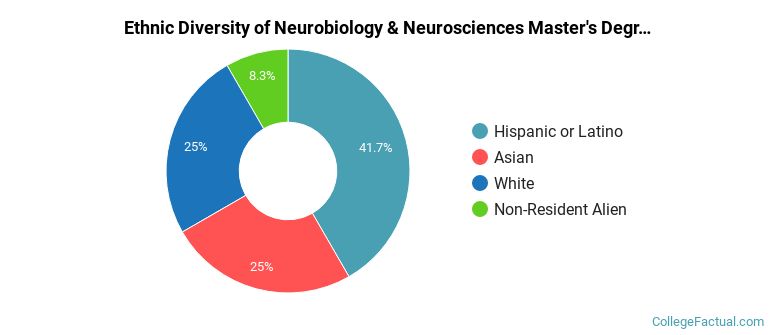
| Ethnic Background | Number of Students |
|---|---|
| Asian | 3 |
| Black or African American | 0 |
| Hispanic or Latino | 5 |
| White | 3 |
| Non-Resident Aliens | 1 |
| Other Races | 0 |
Take a look at the following statistics related to the make-up of the neurobiology majors at Princeton University.
| Related Major | Annual Graduates |
|---|---|
| Biochemistry, Biophysics & Molecular Biology | 96 |
| Ecology, Evolution & Systematics Biology | 57 |
| Biomathematics & Bioinformatics | 20 |
More about our data sources and methodologies.