Explore the best ranked schools for the programs you are most interested in.
QVCC was not ranked in College Factual's Best Overall Colleges report this year. This may be because not enough data was available.
See all of the rankings for Quinebaug Valley Community College.
Returning adults and other non-traditional students may appreciate the fact that Quinebaug Valley Community College has an open admissions policy. This means that you'll only have to submit basic materials, which may include proof that you completed high school or an equivalent program.
The student to faculty ratio at QVCC is an impressive 11 to 1. That's quite good when you compare it to the national average of 15 to 1. This is a good sign that students at the school will have more opportunities for one-on-one interactions with their professors.
Another measure that is often used to estimate how much access students will have to their professors is how many faculty members are full-time. The idea here is that part-time faculty tend to spend less time on campus, so they may not be as available to students as full-timers.
The full-time faculty percentage at Quinebaug Valley Community College is 100%. This is higher than the national average of 47%.
The freshmen retention rate is a sign of how many full-time students like a college or university well enough to come back for their sophomore year. At Quinebaug Valley Community College this rate is 55%, which is a bit lower than the national average of 68%.
During the 2017-2018 academic year, there were 1,161 undergraduates at QVCC with 465 being full-time and 696 being part-time.
| $0-30 K | $30K-48K | $48-75 | $75-110K | $110K + |
|---|---|---|---|---|
| $8,408 | $9,012 | $9,444 | $9,380 | $9,430 |
The net price is calculated by adding tuition, room, board and other costs and subtracting financial aid.Note that the net price is typically less than the published for a school. For more information on the sticker price of QVCC, see our tuition and fees and room and board pages.
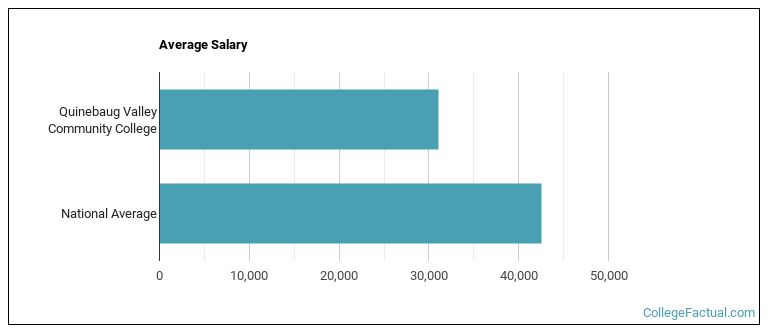
See which majors at Quinebaug Valley Community College make the most money.
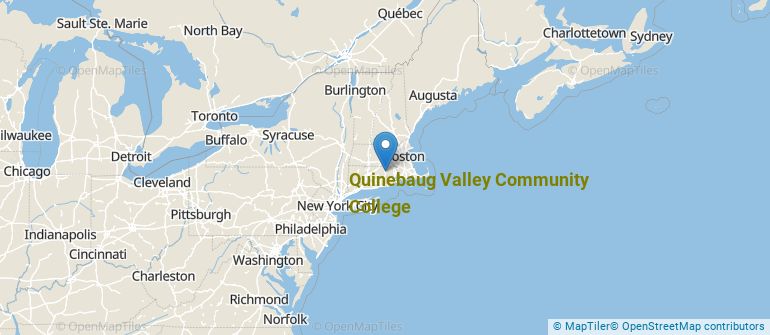
Get more details about the location of Quinebaug Valley Community College.
Contact details for QVCC are given below.
| Contact Details | |
|---|---|
| Address: | 742 Upper Maple St, Danielson, CT 06239-1436 |
| Phone: | 860-932-4000 |
| Website: | https://qvcc.edu/ |
Online learning is becoming popular at even the oldest colleges and universities in the United States. Not only are online classes great for returning adults with busy schedules, they are also frequented by a growing number of traditional students.
In 2020-2021, 800 students took at least one online class at Quinebaug Valley Community College. This is a decrease from the 1,034 students who took online classes the previous year.
| Year | Took at Least One Online Class | Took All Classes Online |
|---|---|---|
| 2020-2021 | 800 | 438 |
| 2019-2020 | 1,034 | 851 |
| 2018-2019 | 359 | 111 |
| 2017-2018 | 362 | 84 |
| 2016-2017 | 404 | 115 |
Learn more about online learning at Quinebaug Valley Community College.
Footnotes
*The racial-ethnic minorities count is calculated by taking the total number of students and subtracting white students, international students, and students whose race/ethnicity was unknown. This number is then divided by the total number of students at the school to obtain the racial-ethnic minorities percentage.
References
More about our data sources and methodologies.