
In its yearly rankings, College Factual analyzes over 2,000 colleges and universities to determine which ones are the best in a variety of categories, such as overall value, quality, diversity, which schools are the best for each major, and much more.
Rappahannock Community College was awarded 12 badges in the 2025 rankings. The highest ranked major at the school is nursing.
Explore the best ranked schools for the programs you are most interested in.
RCC is ranked #1,093 out of 2,152 schools in the nation for overall quality on College Factual's 2025 Best Colleges list. This is an improvement over the previous year, when RCC held the #1,752 spot on the Best Overall Colleges list.
Out of the 57 colleges in Virginia, RCC is ranked at #30.
Returning adults and other non-traditional students may appreciate the fact that Rappahannock Community College has an open admissions policy. This means that you'll only have to submit basic materials, which may include proof that you completed high school or an equivalent program.
The student to faculty ratio is often used as a measure to gauge how much access students will have to their professors - the lower the number, the better. At Rappahannock Community College, this rate is 22 to 1, which is high when compared to the national average of 15 to 1.
When estimating how much access students will have to their teachers, some people like to look at what percentage of faculty members are full time. This is because part-time teachers may not have as much time to spend on campus as their full-time counterparts.
The full-time faculty percentage at Rappahannock Community College is 23%. This is lower than the national average of 47%.
The freshmen retention rate is a sign of how many full-time students like a college or university well enough to come back for their sophomore year. At Rappahannock Community College this rate is 60%, which is a bit lower than the national average of 68%.
During the 2017-2018 academic year, there were 2,629 undergraduates at RCC with 647 being full-time and 1,982 being part-time.
The net price is calculated by adding tuition, room, board and other costs and subtracting financial aid.Note that the net price is typically less than the published for a school. For more information on the sticker price of RCC, see our tuition and fees and room and board pages.
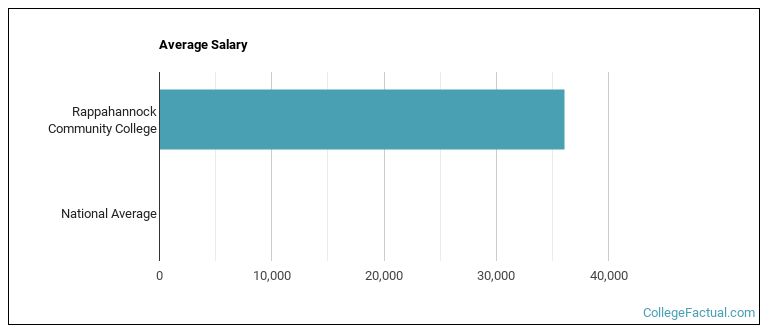
See which majors at Rappahannock Community College make the most money.
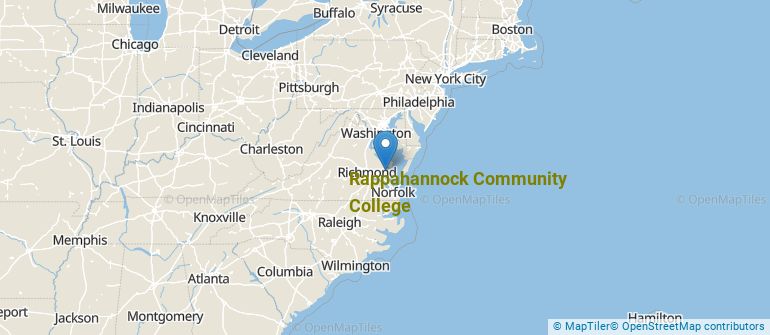
Get more details about the location of Rappahannock Community College.
Contact details for RCC are given below.
| Contact Details | |
|---|---|
| Address: | 12745 College Drive, Glenns, VA 23149-2616 |
| Phone: | 804-758-6730 |
| Website: | www.rappahannock.edu/ |
| Most Popular Majors | Bachelor’s Degrees | Average Salary of Graduates |
|---|---|---|
| Liberal Arts General Studies | 476 | NA |
| Nursing | 169 | NA |
| Practical Nursing & Nursing Assistants | 155 | NA |
| Computer Information Systems | 17 | NA |
| Heating, Air Conditioning, Ventilation & Refrigeration | 16 | NA |
| Culinary Arts | 16 | NA |
| Vehicle Maintenance & Repair | 13 | NA |
| Electronics Engineering Technology | 10 | NA |
| Criminal Justice & Corrections | 10 | NA |
| Business Administration & Management | 9 | NA |
Online courses area a great option for busy, working students as well as for those who have scheduling conflicts and want to study on their own time. As time goes by, expect to see more and more online learning options become available.
In 2022-2023, 1,325 students took at least one online class at Rappahannock Community College. This is an increase from the 1,323 students who took online classes the previous year.
| Year | Took at Least One Online Class | Took All Classes Online |
|---|---|---|
| 2022-2023 | 1,325 | 693 |
| 2021-2022 | 1,323 | 690 |
| 2020-2021 | 1,453 | 830 |
| 2018-2019 | 1,427 | 512 |
Learn more about online learning at Rappahannock Community College.
Footnotes
*The racial-ethnic minorities count is calculated by taking the total number of students and subtracting white students, international students, and students whose race/ethnicity was unknown. This number is then divided by the total number of students at the school to obtain the racial-ethnic minorities percentage.
References
More about our data sources and methodologies.