Jump to any of the following sections:
In College Factual's most recent rankings for the best schools for liberal arts / sciences & humanities majors, RIT came in at #23. This puts it in the top 5% of the country in this field of study. It is also ranked #2 in New York.
| Ranking Type | Rank |
|---|---|
| Best Liberal Arts / Sciences & Humanities Bachelor’s Degree Schools | 22 |
| Best Liberal Arts / Sciences & Humanities Schools | 23 |
During the 2021-2022 academic year, Rochester Institute of Technology handed out 92 bachelor's degrees in liberal arts / sciences & humanities. This is a decrease of 13% over the previous year when 106 degrees were handed out.
Learn about other programs related to Liberal Arts / Sciences & Humanities that might interest you.
Maximize your transfer credits and complete your bachelor's degree faster with this flexible online bachelor's from Southern New Hampshire University.
In 2022-2023, the average part-time undergraduate tuition at RIT was $2,017 per credit hour for both in-state and out-of-state students. Information about average full-time undergraduate tuition and fees is shown in the table below.
| In State | Out of State | |
|---|---|---|
| Tuition | $55,784 | $55,784 |
| Fees | $880 | $880 |
| Books and Supplies | $1,100 | $1,100 |
| On Campus Room and Board | $15,516 | $15,516 |
| On Campus Other Expenses | $1,700 | $1,700 |
Learn more about RIT tuition and fees.
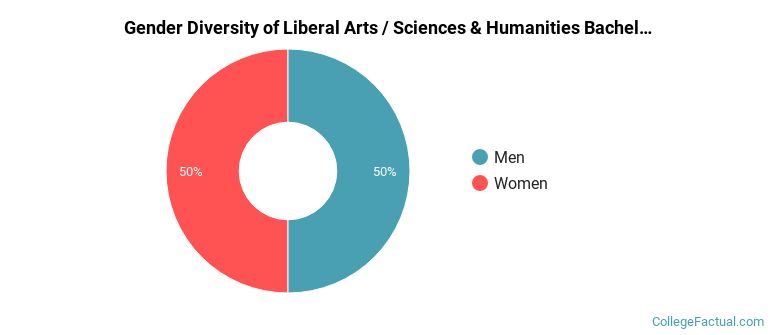
During the 2021-2022 academic year, 92 liberal arts / sciences & humanities majors earned their bachelor's degree from RIT. Of these graduates, 50% were men and 50% were women.
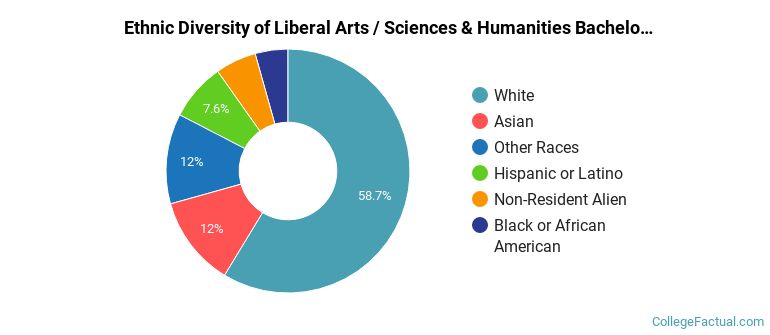
The majority of bachelor's degree recipients in this major at RIT are white. In the most recent graduating class for which data is available, 59% of students fell into this category.
The following table and chart show the ethnic background for students who recently graduated from Rochester Institute of Technology with a bachelor's in liberal arts / sciences & humanities.
| Ethnic Background | Number of Students |
|---|---|
| Asian | 11 |
| Black or African American | 4 |
| Hispanic or Latino | 7 |
| White | 54 |
| Non-Resident Aliens | 5 |
| Other Races | 11 |
If you’re interested in online learning, you’re in luck. RIT does offer online classes in its liberal arts / sciences & humanities bachelor’s degree program. To see if the school offers distance learning options in other areas, visit the RIT Online Learning page.
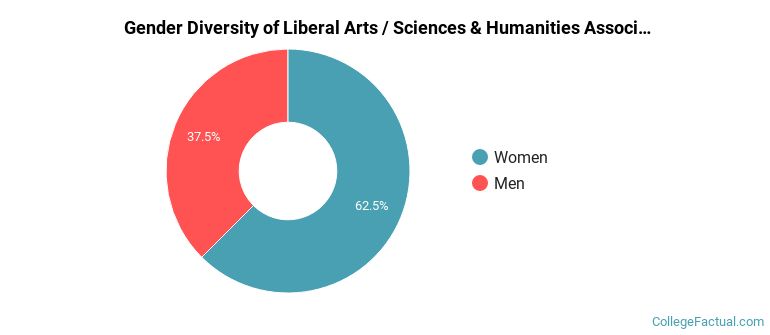
Of the 8 students who earned an associate's degree in Liberal Arts / Sciences & Humanities from RIT in 2021-2022, 38% were men and 63% were women.
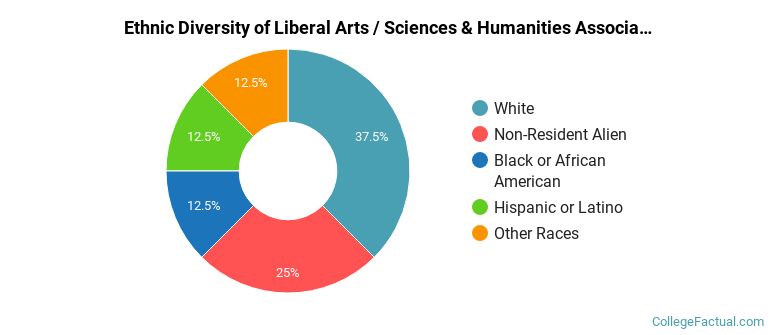
The following table and chart show the ethnic background for students who recently graduated from Rochester Institute of Technology with a associate's in liberal arts / sciences & humanities.
| Ethnic Background | Number of Students |
|---|---|
| Asian | 0 |
| Black or African American | 1 |
| Hispanic or Latino | 1 |
| White | 3 |
| Non-Resident Aliens | 2 |
| Other Races | 1 |
Take a look at the following statistics related to the make-up of the liberal arts / sciences & humanities majors at Rochester Institute of Technology.
Liberal Arts / Sciences & Humanities students may decide to major in one of the following focus areas. Individual majors may not be available for all degree levels.
| Major | Annual Graduates |
|---|---|
| Liberal Arts General Studies | 100 |
| Related Major | Annual Graduates |
|---|---|
| Communication & Journalism | 116 |
| Foreign Languages & Linguistics | 49 |
| Social Sciences | 34 |
| Family, Consumer & Human Sciences | 7 |
| Philosophy & Religious Studies | 4 |
View All Liberal Arts / Sciences & Humanities Related Majors >
More about our data sources and methodologies.
