
College Factual analyzes over 2,000 colleges and universities in its annual rankings and ranks them in a variety of ways, including most diverse, best overall quality, best for non-traditional students, and much more.
Rochester Institute of Technology was awarded 73 badges in the 2025 rankings. The highest ranked major at the school is information technology.
Explore the best ranked schools for the programs you are most interested in.
College Factual ranked RIT as #147 out of 2,152 colleges and universities in the country on its 2025 Best Colleges list. This puts it in the top 10% of all schools in the nation. This is an improvement over the previous year, when RIT held the #285 spot on the Best Overall Colleges list.
RIT also holds the #13 spot on the Best Colleges in New York ranking.
See all of the rankings for Rochester Institute of Technology.
Rochester Institute of Technology has an acceptance rate of 67%, which means the school is serious about who it admits. Take your time in putting together a strong application that highlights why you are a good fit for RIT.
About 45% of students accepted to RIT submitted their SAT scores. When looking at the 25th through the 75th percentile, SAT Evidence-Based Reading and Writing scores ranged between 630 and 710. Math scores were between 640 and 740.
Learn more about Rochester Institute of Technology admissions.
With a student to faculty ratio of 13 to 1, Rochester Institute of Technology is about average in this regard as the nationwide rate is 15 to 1. While this does not translate directly to class size, it's a good indicator of how much time professors will have to spend with their students on a one-on-one basis.
Another measure that is often used to estimate how much access students will have to their professors is how many faculty members are full-time. The idea here is that part-time faculty tend to spend less time on campus, so they may not be as available to students as full-timers.
The full-time faculty percentage at Rochester Institute of Technology is 69%. This is higher than the national average of 47%.
The freshmen retention rate of 85% tells us that most first-year, full-time students like Rochester Institute of Technology enough to come back for another year. This is a fair bit higher than the national average of 68%. That's certainly something to check off in the good column about the school.
The on-time graduation rate is the percent of first-time, full time students who obtain their bachelor's degree in four years or less. This rate is 26% for first-time, full-time students at RIT, which is lower than the national rate of 33.3%.
Find out more about the retention and graduation rates at Rochester Institute of Technology.
During the 2017-2018 academic year, there were 13,412 undergraduates at RIT with 12,122 being full-time and 1,290 being part-time.
| $0-30 K | $30K-48K | $48-75 | $75-110K | $110K + |
|---|---|---|---|---|
| $26,896 | $24,575 | $24,319 | $27,907 | $32,695 |
The net price is calculated by adding tuition, room, board and other costs and subtracting financial aid.Note that the net price is typically less than the published for a school. For more information on the sticker price of RIT, see our tuition and fees and room and board pages.
It's not uncommon for college students to take out loans to pay for school. In fact, almost 66% of students nationwide depend at least partially on loans. At RIT, approximately 63% of students took out student loans averaging $9,891 a year. That adds up to $39,564 over four years for those students.
The student loan default rate at RIT is 1.0%. This is significantly lower than the national default rate of 10.1%, which is a good sign that you'll be able to pay back your student loans.
Get more details about paying for Rochester Institute of Technology.
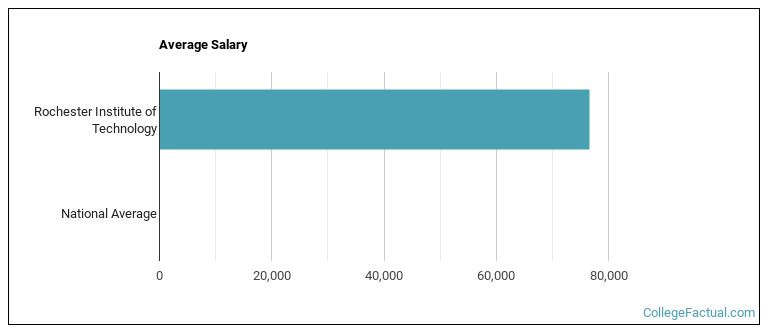
See which majors at Rochester Institute of Technology make the most money.
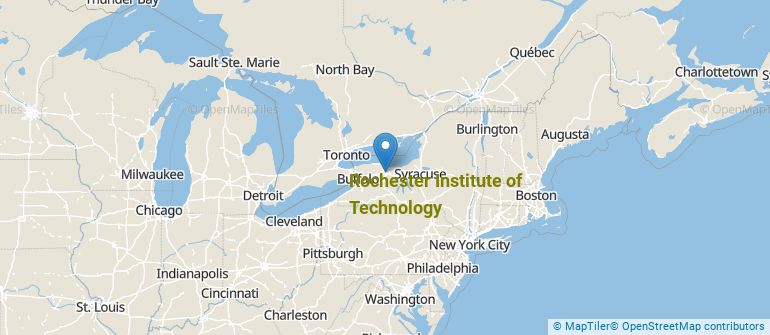
Get more details about the location of Rochester Institute of Technology.
Contact details for RIT are given below.
| Contact Details | |
|---|---|
| Address: | 1 Lomb Memorial Dr, Rochester, NY 14623-5603 |
| Phone: | 585-475-2411 |
| Website: | www.rit.edu/ |
| Most Popular Majors | Bachelor’s Degrees | Average Salary of Graduates |
|---|---|---|
| Computer Science | 349 | $94,611 |
| Computer Software & Applications | 224 | $69,052 |
| Electrical and Computer Engineering. | 173 | NA |
| Design & Applied Arts | 155 | $34,709 |
| Film, Video & Photographic Arts | 137 | $28,858 |
| Computer Information Systems | 134 | $71,358 |
| Information Technology | 114 | $89,032 |
| Business Administration & Management | 113 | $51,040 |
| Liberal Arts General Studies | 100 | $36,318 |
| Allied Health Professions | 88 | $78,298 |
Online learning is becoming popular at even the oldest colleges and universities in the United States. Not only are online classes great for returning adults with busy schedules, they are also frequented by a growing number of traditional students.
In 2022-2023, 6,698 students took at least one online class at Rochester Institute of Technology. This is a decrease from the 10,853 students who took online classes the previous year.
| Year | Took at Least One Online Class | Took All Classes Online |
|---|---|---|
| 2022-2023 | 6,698 | 655 |
| 2021-2022 | 10,853 | 892 |
| 2020-2021 | 13,241 | 1,443 |
| 2018-2019 | 2,665 | 418 |
Learn more about online learning at Rochester Institute of Technology.
If you’re considering Rochester Institute of Technology, here are some more schools you may be interested in knowing more about.
Curious on how these schools stack up against RIT? Pit them head to head with College Combat, our free interactive tool that lets you compare college on the features that matter most to you!
Footnotes
*The racial-ethnic minorities count is calculated by taking the total number of students and subtracting white students, international students, and students whose race/ethnicity was unknown. This number is then divided by the total number of students at the school to obtain the racial-ethnic minorities percentage.
References
More about our data sources and methodologies.