College Factual recognizes the best colleges and universities in its annual rankings. These rankings include categories for best overall colleges, best colleges for each major, best value schools, and much more.
Rose State College was awarded 1 badge in the 2025 rankings. The highest ranked major at the school is cyber/computer forensics and counterterrorism.
Explore the best ranked schools for the programs you are most interested in.
RSC landed the #1,912 spot in College Factual's 2025 ranking of best overall colleges in the United States. The higher ed experts analyzed 2,152 colleges and universities across the nation to determine this ranking.
RSC is also ranked #26 out of 31 schools in Oklahoma.
Since Rose State College has an open admissions policy, being accepted to the school isn't that hard. However, a full basic things - such as a high school diploma or equivalent - may be required. Also, go over your application to make sure it is complete before you submit it.
The student to faculty ratio at Rose State College is 19 to 1, which is high when compared to the national average of 15 to 1. This may indicate that some of your classes will be larger in size than they would be at other schools. However, upper level classes will probably be smaller.
In addition to the student to faculty ratio, some people look at what percentage of faculty members are full-time as a sign of how much time professors will be able to spend with their students. This is because part-time teachers may not be be on campus as much as their full-time counterparts.
The full-time faculty percentage at Rose State College is 40%. This is lower than the national average of 47%.
The freshmen retention rate is a sign of how many full-time students like a college or university well enough to come back for their sophomore year. At Rose State College this rate is 56%, which is a bit lower than the national average of 68%.
During the 2017-2018 academic year, there were 6,722 undergraduates at RSC with 2,450 being full-time and 4,272 being part-time.
| $0-30 K | $30K-48K | $48-75 | $75-110K | $110K + |
|---|---|---|---|---|
| $10,055 | $10,887 | $12,630 | $14,523 | $14,245 |
The net price is calculated by adding tuition, room, board and other costs and subtracting financial aid.Note that the net price is typically less than the published for a school. For more information on the sticker price of RSC, see our tuition and fees and room and board pages.
Almost 66% of college students who graduated with the class of 2018 took out student loans, but that percentage varies from school to school. At RSC, approximately 15% of students took out student loans averaging $4,832 a year. That adds up to $19,328 over four years for those students.
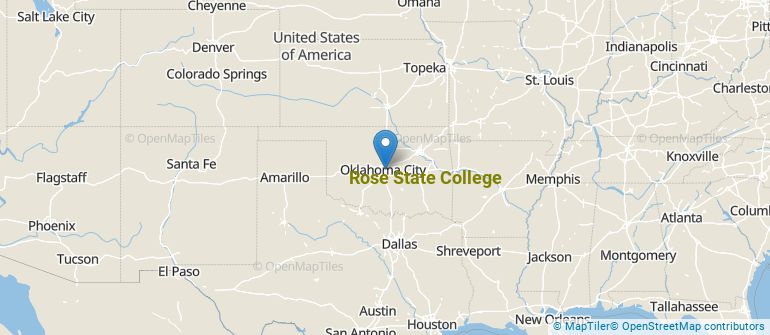
Get more details about the location of Rose State College.
Contact details for RSC are given below.
| Contact Details | |
|---|---|
| Address: | 6420 S E 15Th, Midwest City, OK 73110-2799 |
| Phone: | 405-733-7673 |
| Website: | https://www.rose.edu/ |
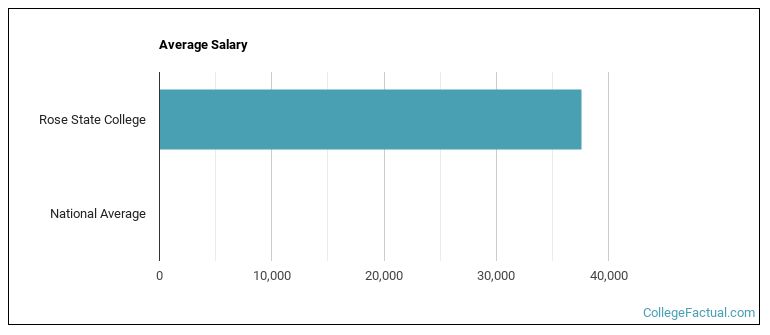
| Most Popular Majors | Bachelor’s Degrees | Average Salary of Graduates |
|---|---|---|
| Liberal Arts General Studies | 190 | NA |
| General Social Sciences | 108 | NA |
| Security Science and Technology | 89 | NA |
| Nursing | 74 | NA |
| General Business/Commerce | 69 | NA |
| Teacher Education Grade Specific | 56 | NA |
| General Psychology | 48 | NA |
| Accounting | 45 | NA |
| Fine & Studio Arts | 30 | NA |
| Business Administration & Management | 26 | NA |
Online learning options are becoming more and more popular at American colleges and universities. Online classes are great for students who have busy schedules or for those who just want to study on their own time.
In 2022-2023, 3,921 students took at least one online class at Rose State College. This is an increase from the 3,857 students who took online classes the previous year.
| Year | Took at Least One Online Class | Took All Classes Online |
|---|---|---|
| 2022-2023 | 3,921 | 1,999 |
| 2021-2022 | 3,857 | 1,972 |
| 2020-2021 | 3,783 | 1,597 |
| 2018-2019 | 3,320 | 1,352 |
Footnotes
*The racial-ethnic minorities count is calculated by taking the total number of students and subtracting white students, international students, and students whose race/ethnicity was unknown. This number is then divided by the total number of students at the school to obtain the racial-ethnic minorities percentage.
References
More about our data sources and methodologies.