Here, you'll find out more about the major, including such details as the number of graduates, what degree levels are offered, ethnicity of students, average salaries, and more. Also, learn how Rutgers New Brunswick ranks among other schools offering degrees in political science.
Go directly to any of the following sections:
Learn about start dates, transferring credits, availability of financial aid, and more by contacting the universities below.
Gain a solid understanding of American political history, the current political landscape, and the major political parties with this online bachelor's from Southern New Hampshire University.
Rutgers New Brunswick was ranked #76 on College Factual's most recent list of the best schools for political science majors. This puts the bachelor's program at the school solidly in the top 15% of all colleges and universities in the country. It is also ranked #2 in New Jersey.
During the 2021-2022 academic year, Rutgers University - New Brunswick handed out 195 bachelor's degrees in political science & government. This is an increase of 13% over the previous year when 173 degrees were handed out.
In 2022, 15 students received their master’s degree in political science from Rutgers New Brunswick. This makes it the #25 most popular school for political science master’s degree candidates in the country.
In addition, 4 students received their doctoral degrees in political science in 2022, making the school the #57 most popular school in the United States for this category of students.
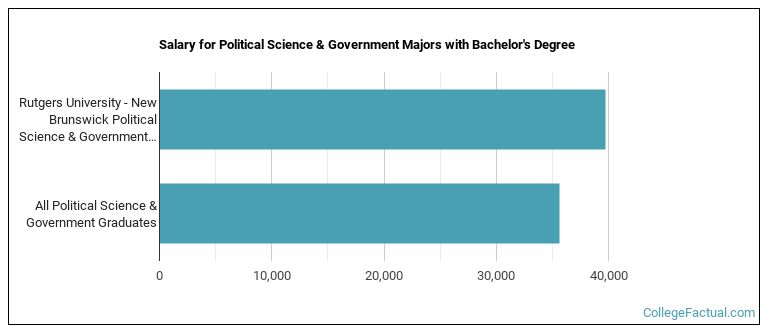
Political Science majors who earn their bachelor's degree from Rutgers New Brunswick go on to jobs where they make a median salary of $39,723 a year. This is great news for graduates of the program, since this figure is higher than the national average of $35,631 for all political science bachelor's degree recipients.
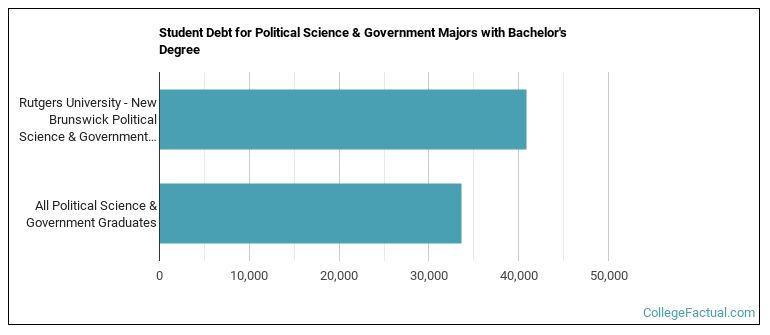
While getting their bachelor's degree at Rutgers New Brunswick, political science students borrow a median amount of $40,862 in student loans. This is higher than the the typical median of $33,583 for all political science majors across the country.
The typical student loan payment of a bachelor's degree student from the political science program at Rutgers New Brunswick is $317 per month.
Out-of-state part-time undergraduates at Rutgers New Brunswick paid an average of $1,054 per credit hour in 2022-2023. The average for in-state students was $441 per credit hour. The following table shows the average full-time tuition and fees for undergraduates.
| In State | Out of State | |
|---|---|---|
| Tuition | $13,674 | $32,436 |
| Fees | $3,565 | $3,565 |
| Books and Supplies | $1,391 | $1,391 |
| On Campus Room and Board | $14,715 | $14,715 |
| On Campus Other Expenses | $4,372 | $4,372 |
Learn more about Rutgers New Brunswick tuition and fees.
For the most recent academic year available, 46% of political science bachelor's degrees went to men and 54% went to women.

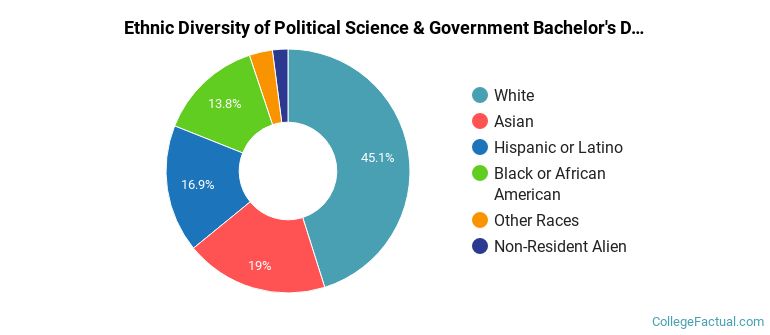
The following table and chart show the ethnic background for students who recently graduated from Rutgers University - New Brunswick with a bachelor's in political science.
| Ethnic Background | Number of Students |
|---|---|
| Asian | 37 |
| Black or African American | 27 |
| Hispanic or Latino | 33 |
| White | 88 |
| Non-Resident Aliens | 4 |
| Other Races | 6 |
Rutgers New Brunswick does not offer an online option for its political science bachelor’s degree program at this time. To see if the school offers distance learning options in other areas, visit the Rutgers New Brunswick Online Learning page.
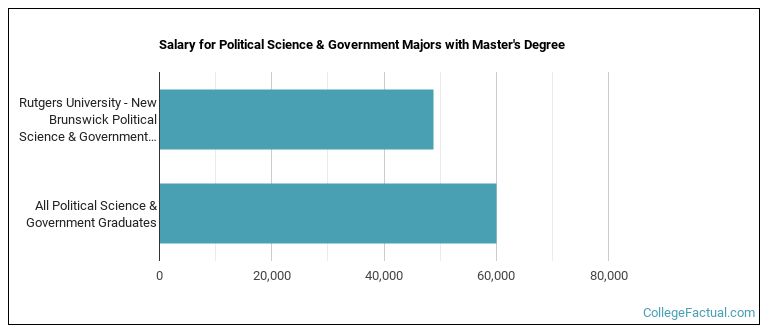
Graduates of the master's political science program at Rutgers New Brunswick make a median salary of $48,847. This is less than what their typical peers from other schools make. Their median salary is $60,055.
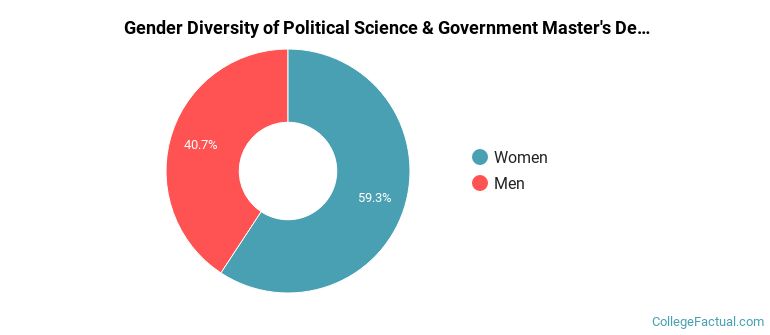
During the 2021-2022 academic year, 27 students graduated with a master's degree in political science from Rutgers New Brunswick. About 41% were men and 59% were women.
The following table and chart show the ethnic background for students who recently graduated from Rutgers University - New Brunswick with a master's in political science.
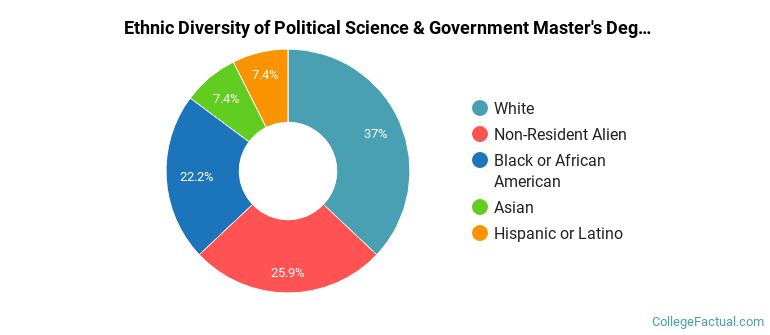
| Ethnic Background | Number of Students |
|---|---|
| Asian | 2 |
| Black or African American | 6 |
| Hispanic or Latino | 2 |
| White | 10 |
| Non-Resident Aliens | 7 |
| Other Races | 0 |
Take a look at the following statistics related to the make-up of the political science majors at Rutgers University - New Brunswick.
| Related Major | Annual Graduates |
|---|---|
| Economics | 279 |
| Sociology | 47 |
| Other Social Sciences | 41 |
| Geography & Cartography | 18 |
| Anthropology | 13 |
More about our data sources and methodologies.
