We've pulled together some essential information you should know about the program, including how many students graduate each year, the ethnic diversity of these students, and more. Also, learn how Sacramento City ranks among other schools offering degrees in psychology.
Jump to any of the following sections:
The bachelor's program at Sacramento City was ranked #567 on College Factual's Best Schools for psychology list.
Online degrees for the Sacramento City psychology bachelor’s degree program are not available at this time. To see if the school offers distance learning options in other areas, visit the Sacramento City Online Learning page.
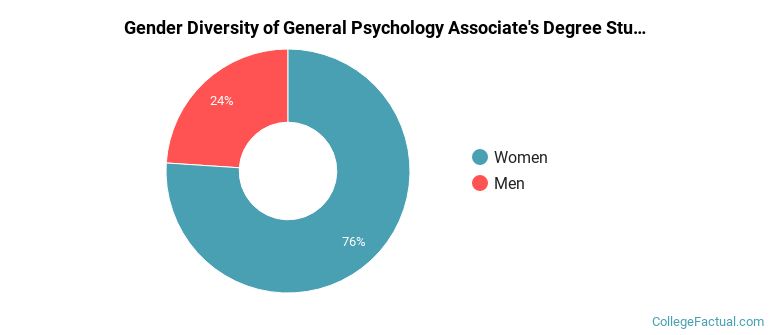
During the 2021-2022 academic year, 167 students graduated with a associate's degree in psychology from Sacramento City. About 24% were men and 76% were women.
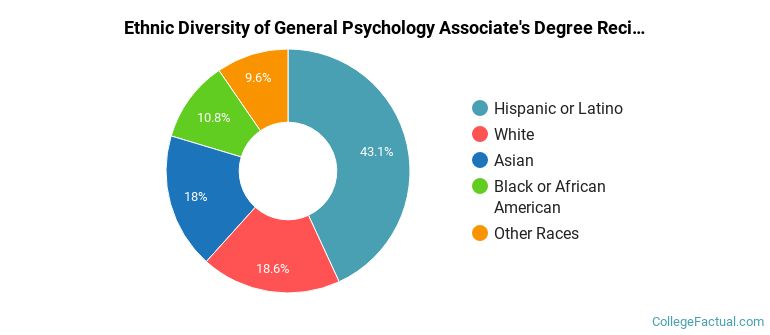
The following table and chart show the ethnic background for students who recently graduated from Sacramento City College with a associate's in psychology.
| Ethnic Background | Number of Students |
|---|---|
| Asian | 30 |
| Black or African American | 18 |
| Hispanic or Latino | 72 |
| White | 31 |
| Non-Resident Aliens | 0 |
| Other Races | 16 |