Below are the key facts about this program at St. Cloud State University; St. Cloud State; SCSU. Degrees are awarded at the Bachelor’s level, with graduate study also available. It ranks as high as #14 out of 14 schools (Bachelor’s level) by College Factual. Jump to any of the following sections:
College Factual ranks St. Cloud State University; St. Cloud State; SCSU among the top schools in the country for teacher education subject specific, coming in at #449 out of 554 schools nationally.
The following degree levels are offered in teacher education subject specific at St. Cloud State University; St. Cloud State; SCSU, along with how many graduates complete each level annually.
| Degree Level | Annual Graduates |
|---|---|
| Bachelor’s | 46 |
| Master’s | 23 |
| Graduate Certificate | 27 |
In the most recent year for which we have data, Saint Cloud State University handed out 46 bachelor’s degrees in teacher education subject specific.
St. Cloud State University; St. Cloud State; SCSU holds a strong position among schools offering teacher education subject specific at the bachelor’s level. Specifically, it ranked #14 out of 14 schools by College Factual.
Teacher Education Subject Specific majors who earn their bachelor’s degree from St. Cloud State University; St. Cloud State; SCSU report a median salary of $42,729 a year. This is lower than $58,906, the median for all majors at St. Cloud State University; St. Cloud State; SCSU.
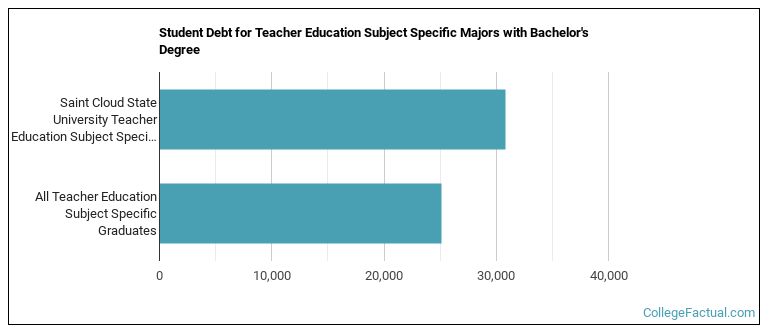
While getting their bachelor’s degree at St. Cloud State University; St. Cloud State; SCSU, teacher education subject specific graduates take on a median debt of $30,795 in student loans. This is higher than $25,125, the typical median for all majors at St. Cloud State University; St. Cloud State; SCSU.
Average full-time tuition and fees are listed in the table below.
| In State | Out of State | |
|---|---|---|
| Tuition | $7,839 | $8,811 |
| Fees | $1,434 | $1,434 |
Read more about St. Cloud State University; St. Cloud State; SCSU tuition and fees.
For the most recent academic year available, 61% of teacher education subject specific bachelor’s degrees went to men and 39% went to women.
 The majority of teacher education subject specific bachelor’s degree graduates at St. Cloud State University; St. Cloud State; SCSU were White. Approximately 87% of graduates fell into this category.
The following table and chart show the ethnic background for students who recently graduated from Saint Cloud State University with a bachelor’s in teacher education subject specific.

| Ethnic Background | Number of Students |
|---|---|
| Asian | 2 |
| Black or African American | 2 |
| Hispanic or Latino | 1 |
| White | 40 |
| Non-Resident Aliens | 1 |
| Other Races | 0 |
St. Cloud State University; St. Cloud State; SCSU conferred 10 bachelor’s degrees in health teacher education in the latest year of data — 20% to women and 80% to men. The largest share of these graduates were White (80%).
St. Cloud State University; St. Cloud State; SCSU awarded 7 bachelor’s degrees in english/language arts teacher education in the most recent reporting year — 57% to women and 43% to men. The largest share of these graduates were White (86%).
St. Cloud State University; St. Cloud State; SCSU granted 6 bachelor’s completions in social studies teacher education in the latest year of data — 50% to women and 50% to men. The largest share of these graduates were White (100%).
St. Cloud State University; St. Cloud State; SCSU granted 5 bachelor’s completions in technology teacher education/industrial arts teacher education recently — 20% to women and 80% to men. Most of these graduates identified as White (100%).
St. Cloud State University; St. Cloud State; SCSU awarded 4 bachelor’s degrees in art teacher education in the most recent reporting year — 100% to women and 0% to men. The most common background among these graduates was White (100%).
St. Cloud State University; St. Cloud State; SCSU granted 4 bachelor’s completions in mathematics teacher education in the most recent reporting year — 50% to women and 50% to men. The largest share of these graduates were White (75%).
St. Cloud State University; St. Cloud State; SCSU awarded 3 bachelor’s degrees in biology teacher education in the most recent reporting year — 0% to women and 100% to men. The largest share of these graduates were White (67%).
St. Cloud State University; St. Cloud State; SCSU granted 3 bachelor’s degrees in music teacher education recently — 33% to women and 67% to men. Most of these graduates identified as White (100%).
St. Cloud State University; St. Cloud State; SCSU granted 2 bachelor’s completions in physical education teaching and coaching in the most recent reporting year — 50% to women and 50% to men. Most of these graduates identified as White (100%).
St. Cloud State University; St. Cloud State; SCSU awarded 1 bachelor’s degree in chemistry teacher education in the latest year of data — 0% to women and 100% to men. The largest share of these graduates were White (100%).
St. Cloud State University; St. Cloud State; SCSU conferred 1 bachelor’s degree in physics teacher education in the latest year of data — 0% to women and 100% to men. The largest share of these graduates were Non-Resident Alien (100%).
Graduate study is also available at St. Cloud State University; St. Cloud State; SCSU. The following graduate award levels are reported.
| Graduate Level | Annual Graduates |
|---|---|
| Master’s Degrees in Teacher Education Subject Specific | 23 |
| Graduate Certificate Degrees in Teacher Education Subject Specific | 27 |
