We've pulled together some essential information you should know about the program, including how many students graduate each year, the ethnic diversity of these students, and more. We've also included details on how SMU MN ranks compared to other colleges offering a major in subject specific ed.
Go directly to any of the following sections:
The subject specific ed major at SMU MN is not ranked on College Factual’s Best Colleges and Universities for Teacher Education Subject Specific. This could be for a number of reasons, such as not having enough data on the major or school to make an accurate assessment of its quality.
During the 2021-2022 academic year, Saint Mary's University of Minnesota handed out 7 bachelor's degrees in teacher education subject specific. Last year, the same number of degrees were handed out.
In 2022, 7 students received their master’s degree in subject specific ed from SMU MN. This makes it the #373 most popular school for subject specific ed master’s degree candidates in the country.
In 2022-2023, the average part-time undergraduate tuition at SMU MN was $1,420 per credit hour for both in-state and out-of-state students. The average full-time tuition and fees for undergraduates are shown in the table below.
| In State | Out of State | |
|---|---|---|
| Tuition | $42,500 | $42,500 |
| Fees | $660 | $660 |
| Books and Supplies | $1,600 | $1,600 |
| On Campus Room and Board | $10,720 | $10,720 |
| On Campus Other Expenses | $1,900 | $1,900 |
Learn more about SMU MN tuition and fees.
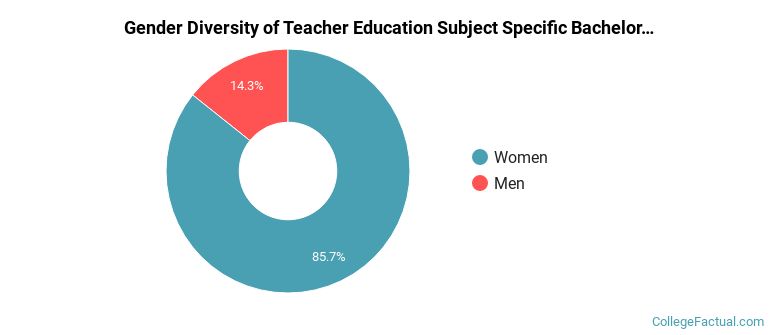
Of the 7 students who earned a bachelor's degree in Teacher Education Subject Specific from SMU MN in 2021-2022, 14% were men and 86% were women.
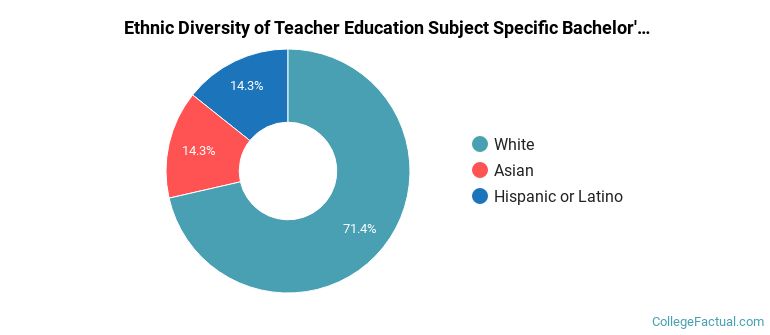
The majority of the students with this major are white. About 71% of 2022 graduates were in this category.
The following table and chart show the ethnic background for students who recently graduated from Saint Mary's University of Minnesota with a bachelor's in subject specific ed.
| Ethnic Background | Number of Students |
|---|---|
| Asian | 1 |
| Black or African American | 0 |
| Hispanic or Latino | 1 |
| White | 5 |
| Non-Resident Aliens | 0 |
| Other Races | 0 |
SMU MN does not offer an online option for its subject specific ed bachelor’s degree program at this time. To see if the school offers distance learning options in other areas, visit the SMU MN Online Learning page.
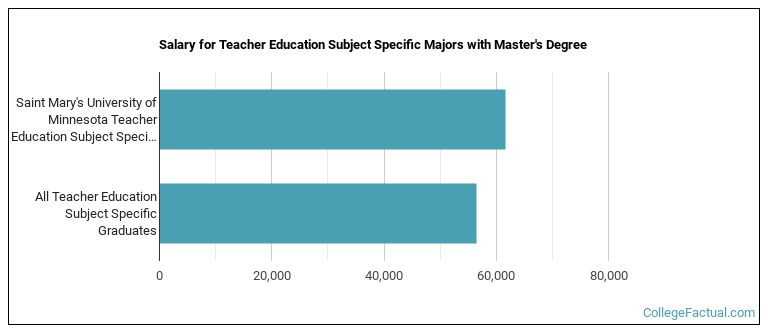
Subject Specific Ed majors graduating with a master's degree from SMU MN make a median salary of $61,702 a year. This is a better than average outcome since the median salary for all subject specific ed graduates with a master's is $56,457.
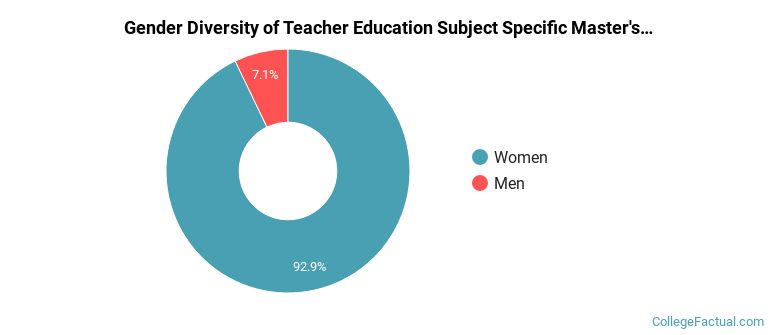
Of the 14 students who graduated with a Master’s in subject specific ed from SMU MN in 2022, 7% were men and 93% were women.
The majority of the students with this major are white. About 64% of 2022 graduates were in this category.
The following table and chart show the ethnic background for students who recently graduated from Saint Mary's University of Minnesota with a master's in subject specific ed.
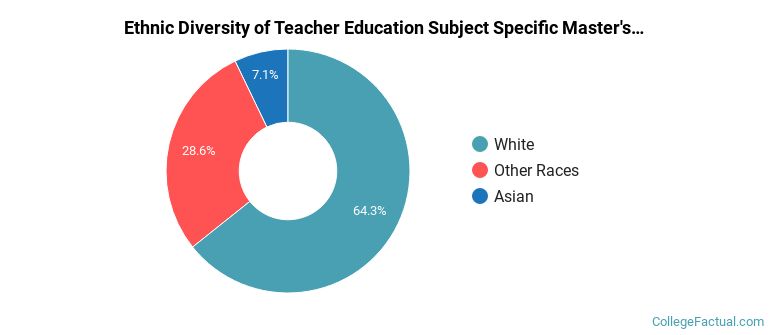
| Ethnic Background | Number of Students |
|---|---|
| Asian | 1 |
| Black or African American | 0 |
| Hispanic or Latino | 0 |
| White | 9 |
| Non-Resident Aliens | 0 |
| Other Races | 4 |
Take a look at the following statistics related to the make-up of the subject specific ed majors at Saint Mary’s University of Minnesota.
| Related Major | Annual Graduates |
|---|---|
| General Education | 169 |
| Educational Administration | 129 |
| Special Education | 50 |
| Instructional Media Design | 45 |
| Teacher Education Grade Specific | 17 |
View All Teacher Education Subject Specific Related Majors >
More about our data sources and methodologies.