In its yearly rankings, College Factual analyzes over 2,000 colleges and universities to determine which ones are the best in a variety of categories, such as overall value, quality, diversity, which schools are the best for each major, and much more.
School of Visual Arts was awarded 5 badges in the 2025 rankings. The highest ranked major at the school is visual & performing arts.
Explore the best ranked schools for the programs you are most interested in.
SVA was not ranked in College Factual's 2025 Best Overall Colleges report. This could be for a number of reasons, including lack of data.
School of Visual Arts has an acceptance rate of 87%, so it is easier to gain admission to this school than some others. Still, the admissions staff will examine your application closely to make sure you're a good fit for SVA.
About 7% of students accepted to SVA submitted their SAT scores. When looking at the 25th through the 75th percentile, SAT Evidence-Based Reading and Writing scores ranged between 600 and 700. Math scores were between 610 and 720.
At SVA, the student to faculty ratio is an excellent 8 to 1. That's much better than the national average of 15 to 1. This indicates that many classes will probably be small, and students will have ample opportunites to work closely with their professors and classmates.
When estimating how much access students will have to their teachers, some people like to look at what percentage of faculty members are full time. This is because part-time teachers may not have as much time to spend on campus as their full-time counterparts.
The full-time faculty percentage at School of Visual Arts is 23%. This is lower than the national average of 47%.
The freshmen retention rate of 86% tells us that most first-year, full-time students like School of Visual Arts enough to come back for another year. This is a fair bit higher than the national average of 68%. That's certainly something to check off in the good column about the school.
Students are considered to have graduated on time if they finish their studies within four years. At SVA the on-time graduation rate of first-time, full-time students is 61%. That is great when compared to the national average of 33.3%
Find out more about the retention and graduation rates at School of Visual Arts.
During the 2017-2018 academic year, there were 3,192 undergraduates at SVA with 3,107 being full-time and 85 being part-time.
| $0-30 K | $30K-48K | $48-75 | $75-110K | $110K + |
|---|---|---|---|---|
| $47,345 | $51,017 | $57,521 | $59,405 | $61,245 |
The net price is calculated by adding tuition, room, board and other costs and subtracting financial aid.Note that the net price is typically less than the published for a school. For more information on the sticker price of SVA, see our tuition and fees and room and board pages.
While almost two-thirds of students nationwide take out loans to pay for college, the percentage may be quite different for the school you plan on attending. At SVA, approximately 26% of students took out student loans averaging $13,163 a year. That adds up to $52,652 over four years for those students.
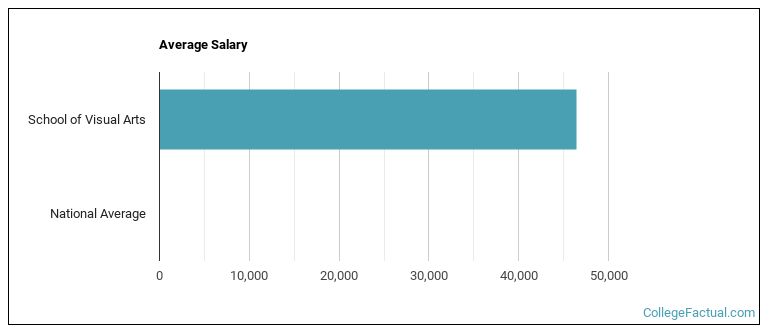
See which majors at School of Visual Arts make the most money.
Get more details about the location of School of Visual Arts.

Contact details for SVA are given below.
| Contact Details | |
|---|---|
| Address: | 209 E 23Rd St, New York, NY 10010 |
| Phone: | 212-592-2000 |
| Website: | www.sva.edu/ |
| Most Popular Majors | Bachelor’s Degrees | Average Salary of Graduates |
|---|---|---|
| Computer Software & Applications | 309 | $36,272 |
| Design & Applied Arts | 297 | $15,985 |
| Film, Video & Photographic Arts | 210 | $20,312 |
| Fine & Studio Arts | 102 | $21,344 |
| Graphic Communications | 88 | $22,478 |
| Human Computer Interaction | 26 | NA |
| Public Relations & Advertising | 22 | NA |
| Rehabilitation & Therapeutic Professions | 14 | NA |
| Museum Studies | 13 | NA |
| Radio, Television & Digital Communication | 12 | NA |
Footnotes
*The racial-ethnic minorities count is calculated by taking the total number of students and subtracting white students, international students, and students whose race/ethnicity was unknown. This number is then divided by the total number of students at the school to obtain the racial-ethnic minorities percentage.
References
More about our data sources and methodologies.